CHAPTER 36/ 45
Algorithmic Execution and Trade Scheduling
Existing engineering evidence is cited under its original acceptance identity. Main thread: convert portfolio target weights into signed parent orders, balance market impact against execution risk on a discrete execution clock, and attribute and benchmark execution quality ex post through an implementation shortfall decomposition. Prerequisites: Chapter 9, Optimization Foundations; Chapter 34, Market Microstructure; and Chapter 35, Transaction Costs and Capacity. After reading, you should be able to schedule TWAP, forecast-volume VWAP, and POV orders; compute the implementation shortfall decomposition with partial and unfilled quantities; derive the discrete Almgren–Chriss mean-variance objective; and reconcile cash and holdings under a causal clock.
1. Learning Objectives
After completing this chapter, you should be able to:
- Distinguish four execution benchmarks—Decision Price, Arrival Price, Ex-Post Market VWAP, and Terminal Mark Price—and explain their evaluation settings and economic meanings.
- Construct discrete child-order schedules for a signed parent order using Time-Weighted Average Price (TWAP), forecast-volume weighting (Forecast-Volume VWAP), and lagged observed volume participation (POV).
- Distinguish decision, send, arrival, fill, marking, and portfolio-signal times, and explain why monthly signal weights must not be presented as intraday microstructure signals.
- Compute signed implementation shortfall (IS), decompose it exactly into delay cost, execution cost, unfilled opportunity cost, and explicit fees, and prove its algebraic identity with the direct monetary comparison of paper and actual portfolios.
- Handle partial-fill and no-fill boundaries. When there are no fills, mark fill VWAP as undefined (NaN/None) to avoid division by zero or misreporting the average as zero.
- Explain the microstructure difference between temporary and permanent price impact, derive the efficient execution frontier under the discrete-time Almgren–Chriss mean-variance objective, and identify its assumptions and limits.
- Reconcile changes in cash, holdings, and net asset value (NAV) after actual fills, without charging cash a second time for price impact already embedded in the fill price.
2. Why Quant Needs This
A strategy constructed on paper may show an excellent Sharpe ratio. Once its orders reach a real market, that paper profit can quickly erode. If a trader sends a market order for tens of thousands of shares, the order can sweep through the shallow top levels of the book and incur substantial temporary market impact. If the trader avoids impact by spreading the order over several days, the price may drift upward with the asset, making later shares more expensive and potentially leaving the target position incomplete at the end of the window.
Unfilled quantity affects execution quality relative to the paper target. Suppose a strategy plans to buy an order but the execution algorithm fills only 20%, after which the price rises. The potential gain on the remaining 80%, measured against the arrival-price benchmark, enters IS as opportunity cost. This is a performance-attribution item, not an actual cash-book expense.
Chapters 14–15 established expected asset returns and factor pricing. Chapter 29 built the portfolio backtest ledger and converted weight changes into target share counts. Chapter 34 introduced visible limit-order-book depth, quoted spreads, and queue priority. Chapter 35 quantified spreads, commissions, borrow costs, and impact functions. This chapter handles the implementation stage of the trading pipeline: it takes the target from Chapters 29 and 35, shows how to distribute the total demand over discrete execution windows, and attributes execution quality after trading. The goal of an execution algorithm is not to predict future returns. It is to balance market-impact cost, which tends to increase with trading speed, against execution risk, as prices drift while execution takes longer.
3. Intuition
Consider a simple scenario. At 09:28, you decide to buy 10,000 shares of a stock whose midpoint is USD 100.00. The order reaches the venue at the 09:30 open, when the price has moved to USD 100.20. You must complete the trade between 09:30 and 10:30.
You face two extremes:
- Extreme 1: At 09:30, submit all 10,000 shares as one market order. Visible depth on the first five ask levels is limited, so your buy order consumes them immediately and pushes the average fill price to USD 101.50. You incur substantial temporary impact, but eliminate the risk that the stock continues to rise during the next hour.
- Extreme 2: Split the 10,000 shares into 60 child orders of about 167 shares per minute. Each child order is only a small fraction of that minute's volume, so the book barely notices you and temporary impact is small. However, if external buying pressure moves the price from USD 100.20 to USD 102.00 during the hour, later child orders become increasingly expensive and the final average fill price may reach USD 101.10. Moreover, if 2,000 shares remain unfilled at 10:30 and must be canceled, you miss all of the gains from a subsequent surge in those shares.
Execution algorithms operate between these extremes:
- TWAP divides the parent order evenly across time slots. It suits assets with relatively uniform liquidity or cases without a volume forecast.
- Forecast VWAP allocates the parent order according to a volume curve frozen before trading. If the forecast curve is heavier around the open and close, the schedule assigns more shares to those intervals.
- POV sets the pace of subsequent requests from the chosen denominator convention and the latest fully observed market volume. Actual fills remain subject to current liquidity and capacity.
Implementation shortfall is the final scorecard. It starts its ledger when you decide to trade and decomposes the result into delay loss between the decision and order submission, slippage on actual fills, missed gains or losses on unfilled quantity, and explicit commissions paid to the broker.
4. Mathematical Foundations
Let
Variables and Notation
-
: timestamp when the portfolio manager makes the rebalance decision; it maps to the interface field decision_timeand benchmark price(USD/share). -
: timestamp when the algorithm receives the parent order; it maps to parent_received_atand satisfies. -
: arrival-benchmark time used for IS; it maps to arrival_timeand price(USD/share). This is an attribution benchmark and must not be conflated with child-order send time or venue-arrival time. -
For each child order
, interface fields child_send_at,child_venue_arrival_at, andfill_atmap respectively to, , and . Fields observed_available_atandforecast_frozen_atrecord when volume data became available and when the forecast was frozen. The slot-end market mark becomes available only atslot_endand is recorded inslot_mark_available_at. Even when there is no fill, first settle the interval using the old mark, then apply the slot-end mark. The terminal mark time is, mapped to terminal_mark_time. -
: start time of execution slot . -
: signed child-order quantity requested in slot (shares), with the same sign as . -
: signed shares actually matched in slot , satisfying . If nonzero, its direction matches and . This chapter considers a single parent order in one direction, so ; this identity must not be generalized to mixed buys and sells. -
: average fill price in slot (USD/share). It is undefined when . -
: cumulative signed shares filled over the execution window: -
: signed shares remaining unfilled and canceled at the end of the execution window (the remainder, in shares), satisfying the conservation identity: -
: execution-window end and terminal-mark timestamp. The corresponding terminal mark is (USD/share). -
: forecast external-market volume for slot , frozen before the window begins (shares). -
: actual external-market volume in slot , fully completed and observed before child order is sent (shares). -
: actual external-market volume during slot (shares). This is still in the future at time and must not be used to decide the child order. -
: explicit commission rate per share (USD/share). Total explicit fees are .
From the Ledger to Execution Evaluation: Continue the Same 100-Share Example
Chapter 34's quotes do not determine actual fills; Chapter 35 books only 60 shares and USD 0.30 in fees. After the window closes, Chapter 36 checks IS using
Now consider selling 100 shares, with only 60 filled, decision price 10.00, arrival price 9.98, fill price 9.95, and terminal price 9.90. Then
Price Process and Market-Impact Assumptions
In this discrete linear-impact teaching specification, the exogenous price increment unaffected by trading follows arithmetic Brownian motion. After adding contemporaneous permanent impact to the midpoint, the price recursion for signed fills under this chapter's buy-positive, sell-negative convention is:
where:
is the constructed midpoint at the end of period , including prior permanent impact (USD/share); it is not an observable “true fundamental price.” is the price-diffusion coefficient. If time is measured in days, is the standard deviation of the one-day price increment. Dividing by a locally constant reference price gives the corresponding daily return volatility in Chapter 35. Its units are USD / (share time ). are independent standard-normal shocks. is signed fill quantity in period ; buys are positive and sells negative. For a sell liquidation, , so the permanent-impact term is . is the permanent market-impact coefficient (USD/share ); permanent impact enters subsequent midpoint prices.
Within each slot, the fill uses
The actual fill price includes temporary market impact:
where
5. Formal Definitions
5.1 Execution Clock and Causal Ordering
In a quantitative trading system, execution, observation, and matching span several clocks. The system must record the signal-freeze time
The timestamps must satisfy these causal constraints:
arrival_time is only the IS benchmark anchor; it does not mean that the algorithm received the parent order or that a child order arrived at the venue. Slot windows may overlap, and the engine processes slots by index while enforcing nondecreasing child send times. Before each send, the algorithm counts only fills strictly earlier than that send and reserves sent-but-unconfirmed quantities against the parent-order remainder. A send at the same timestamp as a fill confirmation occurs first, so that simultaneous fill cannot affect sizing for that send. POV observations must satisfy observed_available_at <= child_send_at, and the forecast curve must be frozen before the first child order is sent. The current simulation uses zero transmission delay, so child_send_at == child_venue_arrival_at. These are enforceable causal-clock constraints; a later child order need not wait for the previous slot to end.
A monthly rebalance signal represents target holdings derived from monthly financial or low-frequency market data and remains frozen throughout the execution day. The algorithm must not disguise a monthly signal as intraday high-frequency alpha or feed future monthly closing data backward into the intraday execution algorithm.
5.2 Time-Weighted Average Price (TWAP)
TWAP distributes the parent order evenly across
The planned child quantity in slot
Conditions:
- Fix the total execution window
and the number of slots before trading begins. - Do not dynamically add to or reduce parent order
during the window.
5.3 Forecast-Volume VWAP Schedule
A VWAP schedule aims to match the shape of child orders to the market's expected intraday volume curve.
Let
The planned child quantity in slot
Conditions:
- The weight vector
must depend only on historical statistics (for example, the median volume in each slot over the previous 20 trading days) and must be frozen completely at . - The schedule must not use future realized external volume
from the current trading day as an input.
The expressions above, like execute_order mechanically reallocates unfilled quantity across later slots based on the current parent remainder. This capacity-constrained catch-up rule does not read future volume and is not an adaptive schedule that updates price or total-volume forecasts from intraday information.
5.4 Ex-Post Market VWAP Benchmark
Ex-post market VWAP is a public external benchmark price used to evaluate institutional execution quality after the whole window has ended:
Here,
5.5 Lagged-Observed Percentage of Volume (POV)
POV, also called a participation-rate algorithm, is reactive. Instead of specifying a complete fixed allocation in advance, it sets target order pace from available liquidity information under a chosen denominator convention. Actual participation remains subject to fills, cancellations, and capacity.
Under a strict causal clock, the algorithm does not know future realized external volume
For a participation rate
The following participation-rate equations first define an uncapped reference request. After the minimum with the remainder is applied, the actual request may fall below that participation rate; actual fills are also constrained by current-slot capacity.
Definition A (exclusive denominator, external-market volume only):
For a nonoverlapping hand calculation, assume prior fills have all been confirmed before the next send and no orders are in flight; only then can one write
Definition B (inclusive denominator, including own fills):
The child quantity is therefore:
Boundary and validity conditions:
- First-slot boundary: At the first open-market slot,
, no prior continuous-trading volume is yet observable, so . Under the contract, POV sends zero in the first slot and waits until that slot's volume has settled before following the market. - Limit test: Definition B has a finite solution only for
. As with positive external volume, the uncapped inverse formula diverges; after capping at the finite remaining order, the actual request remains finite. Implementations often also cap requests by remaining quantity, a participation-policy ceiling, and market capacity. A ceiling such as 0.5 is an implementation choice, not a universal threshold implied by the identity.
5.6 Implementation Shortfall (IS)
Perold (1988) is retained here as further reading; the historical check covered author and publisher metadata, without reading the full text. The SEC (2003) discusses cost measurement through the difference between paper and actual portfolios and traces an early source of the idea to Treynor (1981). That request for comments supplies conceptual background, rather than prescribing this chapter's formula. The decomposition below is an explicit teaching convention, not a claim of a single industry-standard method.
For signed parent order
Its components are:
-
Delay cost (slippage from decision):
This measures losses from adverse price movement between the portfolio manager's decision and the order's arrival at the market.
-
Execution slippage cost:
When
, if fill VWAP is defined as , then execution cost can also be written as: This measures slippage of actual fills relative to the arrival benchmark.
-
Unfilled opportunity cost:
This measures potential mark-to-market gains or losses missed because the remainder
was not traded by the deadline. -
Explicit fees:
These are explicit commissions and taxes paid to the broker or venue.
By convention,
6. Derivations
6.1 Algebraic Proof of the Two Equivalent Representations of IS
In practice, implementation shortfall can be computed in two ways:
- A four-component decomposition aligned with the workflow: delay, execution, opportunity, and explicit fees.
- The direct amount method, which directly compares the terminal value of the theoretical paper portfolio with the actual execution cash ledger.
Theorem. The four-component decomposition is algebraically identical to the direct amount method.
Proof. Under the direct amount method, the frictionless paper portfolio is assumed to buy all
In actual execution, we buy
Define implementation shortfall as the difference between paper and actual profit:
Substituting the profit expressions gives:
Using quantity conservation,
Cancel the
Since
This is the classic direct amount formula.
To prove its identity with the four-component decomposition, insert the arrival price
For unfilled quantity:
Substituting both expansions into the direct amount formula:
Collect the common factor
Rearranging the terms:
This proves the result.
The proof shows the sign symmetry: the signed formulas are self-consistent for either a buy (
Other papers or trading systems may allocate the decision-to-arrival price move across filled quantity or use a different opportunity-cost benchmark. This chapter assigns the full
6.2 Deriving the Discrete Almgren–Chriss Execution Cost–Risk Frontier
Consider liquidating an initial position of
The number of shares sold in slot
From the price process in Section 4:
The fill price includes temporary impact:
Total liquidation proceeds are
Step 1: Derive expected shortfall
Substitute into the fill-price expression:
Total proceeds are:
Since
Use the discrete-sum identity:
Substituting this into expected shortfall gives:
This section assumes
The discrete identity regroups total cost as a constant and a path-dependent term:
The term
still depends on the schedule. Its
Numerical check: let
Here
Using fixed endpoints
This is an integral identity after evaluating the boundary terms; the integrands are not equal at each instant. In Challenge 36-C01,
Step 2: Derive shortfall variance
Reverse the order of summation:
because the
Execution variance is therefore the accumulated squared remaining inventory over time: a larger position held for longer carries more price risk.
Step 3: Solve the optimization problem. Expected shortfall is measured in USD, while variance is measured in USD
For any intermediate state
Divide by
The characteristic equation is
Here the inventory nodes use
Special cases. When
Then
When
7. Financial Interpretation
7.1 Agency and the Choice of Benchmark
The benchmark chosen for an execution algorithm directly affects the trader's incentives:
- Arrival Price: When an order is meant to stay close to the price at the agreed post-decision arrival point, arrival price can evaluate delay and subsequent execution. Waiting is risky if the signal is expected to decay or price drift is adverse; the direction and speed of drift must be estimated from data and do not follow from the benchmark definition itself.
- Market VWAP: When the goal is to compare fills with the market's average traded price over a defined window, use this benchmark. The schedule still needs an ex-ante forecast-volume curve; market VWAP is computed from eligible market trades after the window ends.
7.2 The Economic Meaning of Unfilled Opportunity Cost
If evaluation counts slippage only on filled shares and sets the opportunity term on canceled remainder,
For example, consider a constructed order to buy 50,000 shares. If only 5,000 shares fill before the deadline and the remaining 45,000 are canceled, a terminal price above arrival price means that fill slippage alone does not capture the result of the full decision. Under this chapter's IS convention,
For a counterexample, take
7.3 Microstructure of Temporary and Permanent Impact
- In this model, temporary impact affects only the current fill price and does not carry into the next slot's midpoint. This is a modeling assumption. In real markets, liquidity replenishment and price decay vary, and event data are needed to estimate them; there is no guarantee that the price recovers within tens of seconds.
- Permanent impact is the lasting effect of trading on subsequent prices in the price-update model. Information content, liquidity-provider inventory, and other mechanisms may all contribute; the decomposition alone does not identify a causal source. Huberman and Stanzl (2004), under a framework with uncertain prices, price impact from trading volume, and time-independent permanent price updates, prove that excluding quasi-arbitrage requires linear permanent price impact. Their abstract notes that when temporary impact is also present, only the permanent component must be linear. This theorem is not an empirical law for every market-impact path.
7.4 Model Assumptions and Practical Limits
The Almgren–Chriss model provides a clear closed-form solution, but has important limits in live deployment:
- It assumes the fundamental price is a driftless random walk. Quantitative rebalancing often involves decaying alpha signals, and an asset may have a deterministic drift component.
- It assumes market liquidity and volatility are constant throughout the day. Many equity samples show higher trading volume near the open and close, but the shape, spread, and depth vary by market, asset, time, and event; schedules must be re-estimated on suitable data.
- The static schedule in this chapter does not adjust its speed in response to intraday price shocks. If the objective permits dynamic feedback and the inputs support real-time estimation, dynamic programming or a Hamilton–Jacobi–Bellman (HJB) method can construct another class of execution strategy. That requires additional modeling and validation.
8. Numerical Example
This section gives one unified, constructed teaching example. Every input is labeled as constructed for instruction. The purpose is to check causal timestamps, child-order schedules, matching, IS decomposition, and cash/position reconciliation.
8.1 Setup and Inputs
Consider a signed buy parent order:
- Parent-order size:
shares (buy). - Decision time:
; decision price /share. - Arrival time:
; arrival price /share. - Execution window: four discrete 15-minute slots, ending at
. - Terminal mark:
/share. - Commission rate:
/share. - Participation cap: actual fills in each slot may not exceed 20% of realized external volume in that slot (
).
The constructed UTC window below is not a real market open. Each slot's price serves as both an external average-price proxy and midpoint proxy, and the example explicitly sets our fill equal to it (zero half-spread and zero impact of both kinds). In general execution, they differ.
The external market stream and forecast data are constructed for instruction:
| Slot |
Time interval | Forecast external volume |
Prior observed external volume |
Realized external volume |
Fill price |
|---|---|---|---|---|---|
| 1 | 09:30–09:45 | 40,000 | 0 (no intraday volume before open) | 35,000 | 100.30 |
| 2 | 09:45–10:00 | 30,000 | 35,000 | 25,000 | 100.50 |
| 3 | 10:00–10:15 | 20,000 | 25,000 | 20,000 | 100.70 |
| 4 | 10:15–10:30 | 10,000 | 20,000 | 20,000 | 100.90 |
| Total | 100,000 | — | 100,000 | — |
The ex-post market VWAP across external market volume is:
8.2 Algorithm 1: Time-Weighted Average Price (TWAP)
-
Schedule. There are
slots. The planned child quantity in each is shares. -
Fills and capacity.
- Slot 1: cap
, so . - Slot 2: cap
, so . - Slot 3: cap
, so . - Slot 4: cap
, so . Cumulative fill is shares and remainder is shares.
- Slot 1: cap
-
Fill VWAP.
-
IS decomposition.
- Delay cost:
. - Execution cost:
. - Opportunity cost:
. - Explicit commission:
. - Total IS:
.
- Delay cost:
-
Direct-amount check.
The two calculations agree exactly.
8.3 Algorithm 2: Ex-Ante Forecast-Volume VWAP
-
Schedule. Total forecast volume is
shares. Forecast weights are . Planned child quantities are: shares. shares. shares. shares.
-
Fills and capacity.
- Slot 1: cap
, so . - Slot 2: cap
, so . - Slot 3: cap
, so . - Slot 4: cap
, so . Cumulative fill is shares and remainder shares.
- Slot 1: cap
-
Fill VWAP.
The forecast-VWAP fills average 100.5000, better than the full external-market VWAP of 100.5500, because a larger share of the order was completed in the lower-priced early slots.
-
IS decomposition.
- Delay cost:
. - Execution cost:
. - Opportunity cost:
. - Explicit commission:
. - Total IS:
.
- Delay cost:
-
Direct-amount check.
The results agree.
8.4 Algorithm 3: Lagged-Observed POV with Partial Fills
Set the target participation rate to
-
Causal schedule and fills.
- Slot 1 (09:30): No intraday observation is yet available, so
and shares. Fill ; the remaining demand for slot 2 is shares. - Slot 2 (09:45): The complete external volume from slot 1 is now observed:
. Request shares. The current capacity cap is , so . Remaining demand for slot 3 is shares. - Slot 3 (10:00): Slot 2's external volume is observed:
. Request shares. Capacity is , so . Remaining demand for slot 4 is shares. - Slot 4 (10:15): Slot 3's external volume is observed:
. Request shares. Capacity is , so . At the window close, the unfilled remainder is shares.
- Slot 1 (09:30): No intraday observation is yet available, so
-
Filled and unfilled totals. Cumulative fill is
shares; canceled remainder is . Conservation check: . -
Fill VWAP.
-
IS decomposition.
- Delay cost:
. - Execution cost:
. Equivalently, . - Opportunity cost:
. - Explicit commission (charged only on actual fills):
. - Total IS:
.
- Delay cost:
-
Direct-amount check.
Both formulas agree.
8.5 Boundary Case: Undefined VWAP with No Fills
Consider a separate constructed boundary with zero capacity and no fills. Keep decision price 100, arrival price 100.20, terminal price 101, and set execute_order simulates a limit book or a trading halt.
-
Fill VWAP status:
Preserve the undefined state; never record it as 0.00 in the ledger.
-
IS decomposition:
- Delay cost:
. - Execution cost:
; there are no fills, so the slippage sum is empty and equals zero. - Opportunity cost:
. - Explicit fees:
. - Total IS:
.
- Delay cost:
-
Direct-amount check:
Even at the no-fill boundary, opportunity cost captures the unrealized move from arrival to terminal price. Together with delay cost, it captures the full decision-to-terminal difference for the paper order, so the formulas remain consistent.
8.6 Symmetry Check: Signed Sell Parent Order
Now let the parent order be a sale of
- Delay cost:
. - Fill VWAP:
. - Execution cost:
. - Opportunity cost:
. - Explicit commission:
. - Total IS:
.
Direct amount:
This verifies the signed formula's symmetry for buys and sells.
9. Python Implementation
The default I3 reader package uses a self-contained four-cell notebook with a small constructed IS example. It writes JSON and one figure into a unique RUN_DIR; the outer runner run_notebook.py at the package root preserves an execution copy and execution JSON. This is not a complete CLI, a Project 4 historical walk-forward, or a market experiment. The English notebook-language layer and full-package cold-start validation are deferred to BIL23.
Engineering execution uses the dimensionless-coefficient model described in Chapter 35, Section 5.4. The discrete Almgren–Chriss derivation in Section 6.2 is an analytic teaching model under its stated assumptions; it must not be presented as if the engine had been calibrated with the same diffusion or risk parameters. For the current Project 4 result identity, see Chapter 35, Section 10.3 and the current acceptance entrypoint; old R2R6 material is historical constructed evidence only. This chapter and the experiment share the quant_course.execution_costs module; they do not create a second fee, scheduling, or IS engine. ExecutionSlot keeps ex-ante forecast volume, pre-send observed volume, and current realized volume separate, and records availability in observation_time. execute_order returns fills, terminal remainder, a signed IS decomposition, and a direct-amount check.
The code below reproduces the constructed forecast-VWAP example in Section 8. To match the hand-calculation table, spread and both temporary and permanent impact are set to zero, and only per-share commission is booked; market volume still imposes the participation-capacity constraint.
import datetime as dt
from quant_course.execution_costs import (
    ExecutionConfig, ExecutionPortfolioLedger, ExecutionSlot,
    ParentOrder, execute_order,
)

UTC = dt.timezone.utc
start = dt.datetime(2026, 10, 9, 9, 30, tzinfo=UTC)
forecast = [40_000, 30_000, 20_000, 10_000]
observed = [0, 35_000, 25_000, 20_000]
realized = [35_000, 25_000, 20_000, 20_000]
mid = [100.30, 100.50, 100.70, 100.90]
slots = []
for k in range(4):
    slot_start = start + dt.timedelta(minutes=15 * k)
    observation_time = None if k == 0 else slot_start
    slots.append(ExecutionSlot(
        slot_index=k,
        slot_start=slot_start,
        slot_end=slot_start + dt.timedelta(minutes=15),
        send_time=slot_start,
        fill_time=slot_start + dt.timedelta(minutes=7),
        forecast_external_volume=forecast[k],
        observed_external_volume=observed[k],
        realized_external_volume=realized[k],
        mid_price=mid[k],
        observation_time=observation_time,
    ))
parent = ParentOrder(
    order_id="teaching-buy", asset="XYZ", signed_quantity=10_000,
    decision_time=start - dt.timedelta(minutes=2), arrival_time=start,
    decision_price=100.00, arrival_price=100.20,
)
config = ExecutionConfig(
    commission_rate=0.0,
    commission_per_share=0.005,
    half_spread_bps=0.0, temp_impact_coef=0.0, perm_impact_coef=0.0,
    max_participation=0.20,
)
result = execute_order(
    parent, "VWAP", slots, config,
    terminal_mark_price=101.00,
    terminal_mark_time=slots[-1].slot_end,
)
assert result.signed_parent_quantity == result.signed_filled_quantity + result.signed_remainder_quantity
assert abs(result.is_decomposition.identity_discrepancy) < 1e-9
assert result.fill_vwap == 100.50
assert abs(result.is_decomposition.total_is_decomposition - 5_050.00) < 1e-8

ledger = ExecutionPortfolioLedger(2_000_000.00, config, start)
for fill in result.fills:
    ledger.post_fill("XYZ", fill, {"XYZ": fill.mid_price})
assert ledger.positions["XYZ"] == 10_000
assert ledger.reconcile_ledger()["is_exact"] == 1.0
The fill price already includes spread and temporary impact. The cash ledger deducts only actual fill consideration and commission. The total_is_decomposition field is an evaluation metric relative to decision price and must not be deducted from cash again. Tests in the same module cover formal boundaries, sells, and no fills.
10. Visualization
The two figures below are inherited from the accepted original and were not rerun in this batch. The original figures/build_figures.py script generates them from explicitly listed constructed parameters and also saves a numerical CSV for the Almgren–Chriss frontier. They illustrate model directions, not execution costs or optimal strategies for real securities.
Figure 1: Cumulative Fills for the Same Parent Order
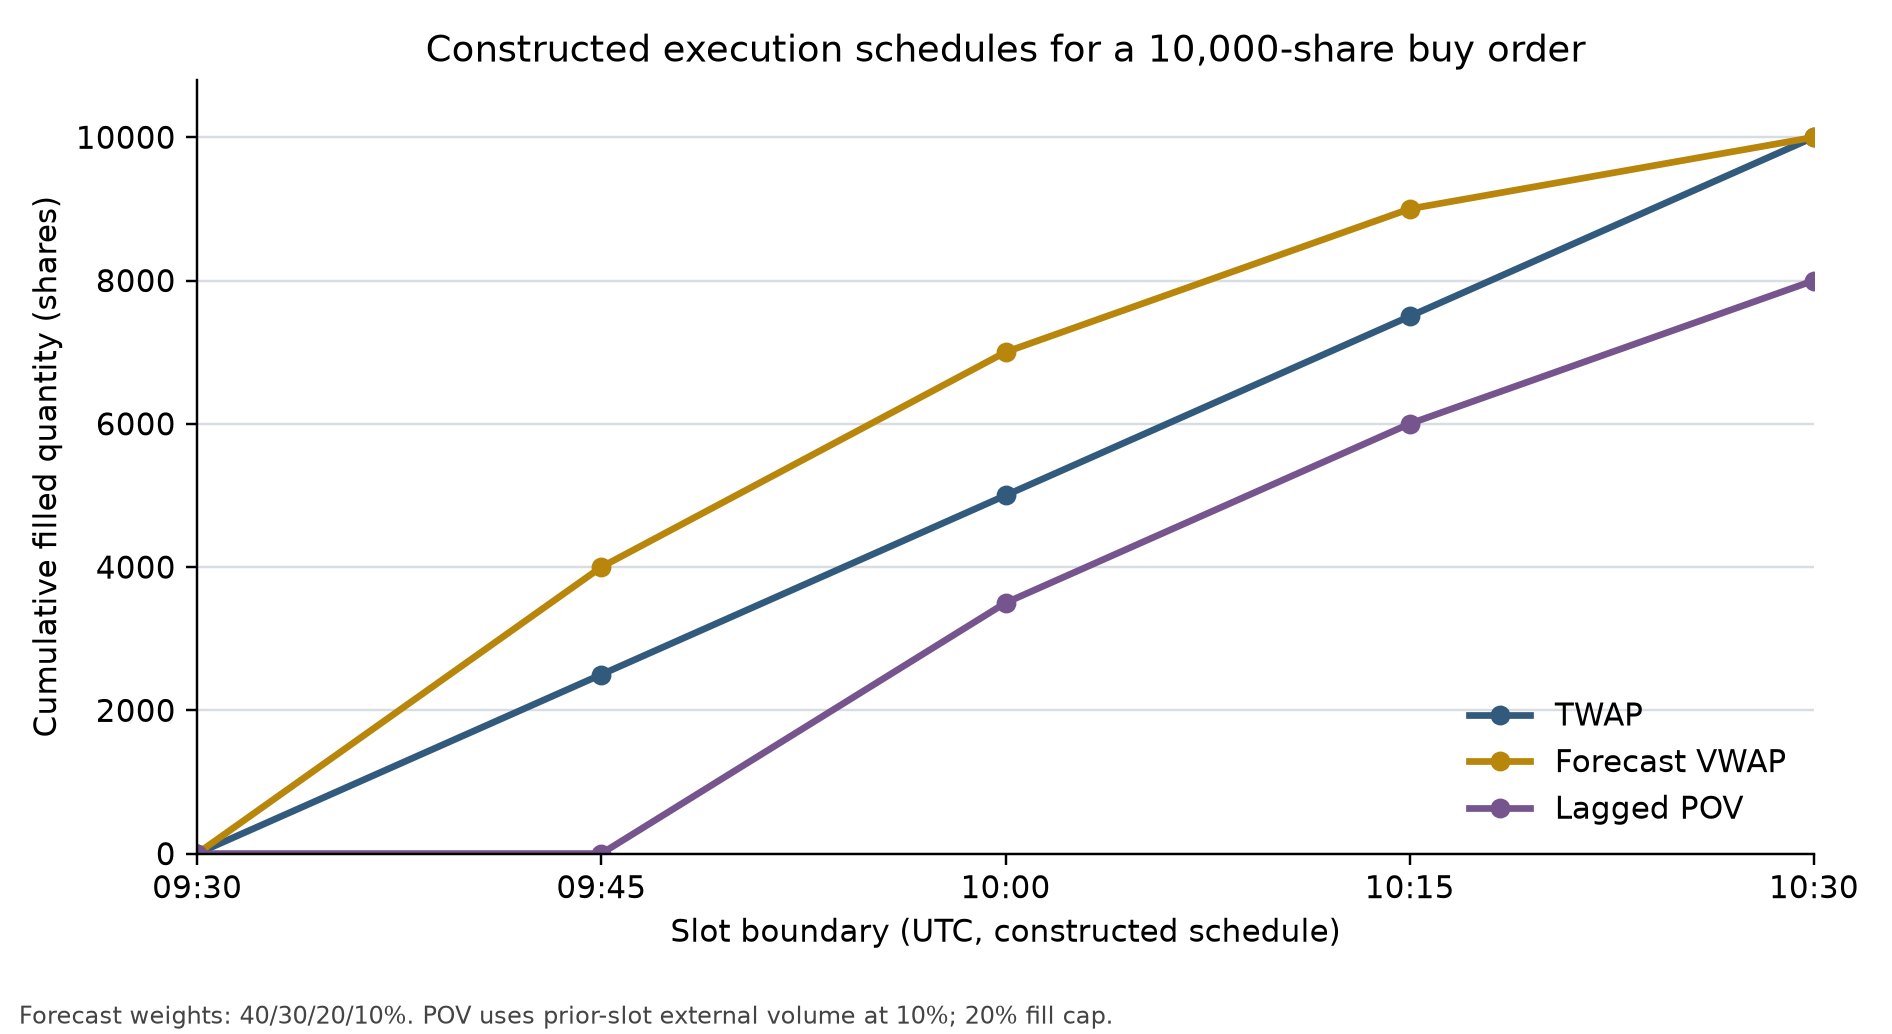
TWAP requests 2,500 shares per slot. Forecast VWAP allocates according to the ex-ante 40/30/20/10% curve. Lagged POV makes no request in the first slot because no volume has yet been observed, then requests 10% of the previous slot's volume, subject to a 20% cap on current external volume. The vertical axis is cumulative shares filled and the horizontal axis is the constructed clock's slot boundaries. POV ends with 2,000 shares remaining.
Figure 2: Discrete Almgren–Chriss Expected Cost and Risk
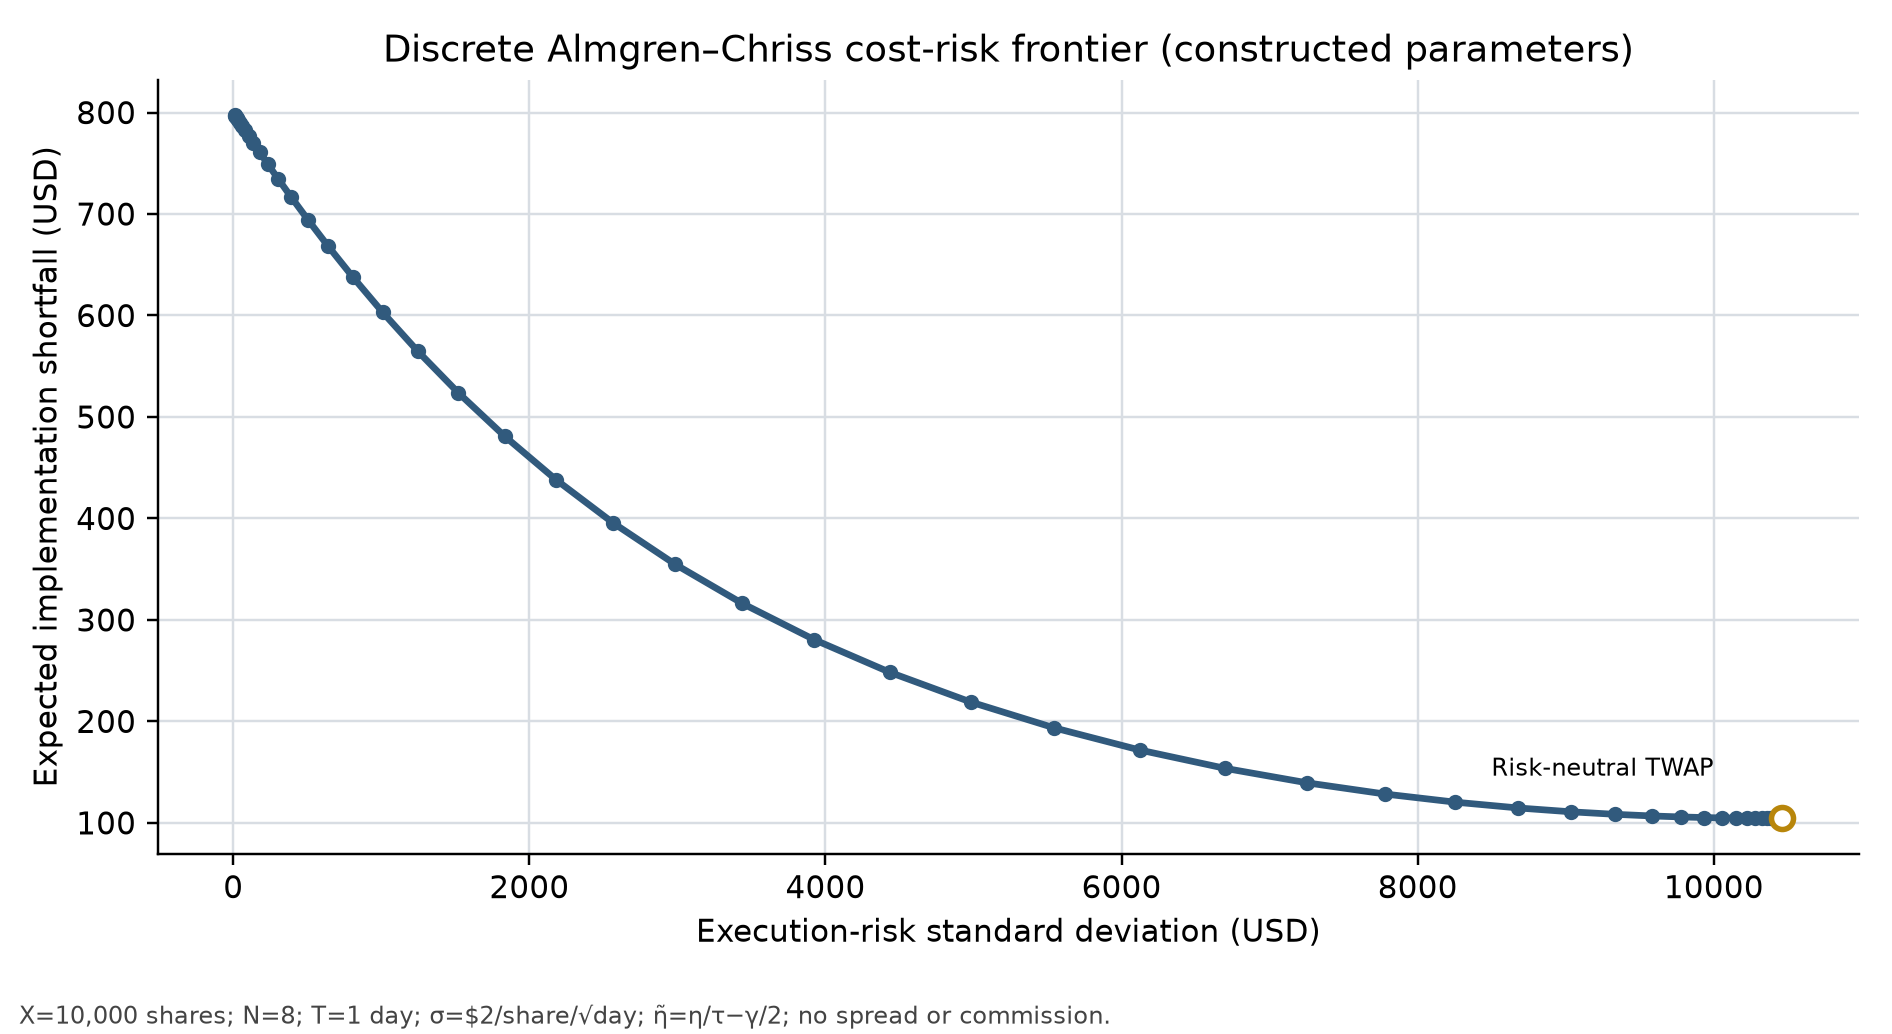
Each point is calculated from the discrete inventory recursion, with a fixed 10,000-share parent order, 8 slots, and a total duration of one day;
11. Evidence Boundary and TCA Study Design
This batch has no real tick-by-tick fills, order-book data, or institutional execution sample. It therefore reports no real-security case or empirical slippage. This section follows the data boundary recorded in qa/a7/ch35_ch36_batch/SOURCE_DATA_GAP.md and offers a study-design example for future work with appropriately authorized data.
11.1 Available Data and Gaps
- No tick-level or Level 2 feeds. The current course environment contains daily and monthly factor-analysis data, such as Kenneth French industry portfolio returns. It has neither purchased nor mounted full-market historical millisecond trade prints, five- or ten-level order-book snapshots, nor a full-depth message feed such as Nasdaq TotalView-ITCH. The order-book sweeps and slot fills shown in the chapter are constructed for instruction and cannot be used to infer historical tick-level execution slippage for particular US or A-share securities.
- No borrow or financing series. Historical security-level borrowable lists, borrow-fee rates and hard-to-borrow surcharges, and broker recall records are unavailable. The empirical feasibility of short sales cannot be closed end to end.
- No broker TCA sample. There are no institutional parent-order execution details for large orders. Values such as square-root impact constants and temporary-impact shares are teaching parameters, not empirical estimates for real markets.
11.2 Example TCA Design with Real Data
With appropriately authorized market and order data, a researcher could preregister the relevant conventions for the question at hand. The steps below are an example analysis workflow, not a universal industry standard:
-
Collect and align data. Record the OMS/EMS parent-order decision timestamp
, route-send time , and exchange fill-confirmation time at microsecond or nanosecond precision. Align fills to the relevant exchange's consolidated market-data feed. -
Capture benchmarks.
- Arrival midpoint: use the national best bid and offer midpoint at the agreed parent-order arrival instant,
. - Market VWAP: define the trade window and eligible prints according to the research question, market-data source, and benchmark. Inclusion rules for auctions, off-exchange or block prints, corrections, and late reports vary by benchmark and must be documented in advance; do not assume that one set should always be excluded.
- Arrival midpoint: use the national best bid and offer midpoint at the agreed parent-order arrival instant,
-
Factorized impact regression. If appropriately authorized data become available, a future study could regress parent-order slippage on trading characteristics. No estimation is performed in this batch:
Here
indexes orders, is signed share quantity (positive for buys and negative for sells), and is the security's average daily share volume. Use one day's share volume in the denominator so that is a fraction of daily volume; do not mix shares with dollar volume. The dependent variable is a direction-adjusted price deviation in USD/share, for example . Both , the standard deviation of one-day price changes estimated from a window frozen before the decision, and , the full spread, are in USD/share. The intercept and residual therefore also have units USD/share, while and are dimensionless. For a sell order with and , the original is outside the real domain; the corrected value is . This is a future study design, with no real-data calibration in this batch. Slippage or costs under constructed parameters do not establish real strategy capacity.
12. Common Mistakes
This section covers six common errors in execution algorithms and trade scheduling. Each includes a symptom, underlying cause, incorrect code, a repair, and numerical implications.
12.1 Mistake 1: Look-Ahead Bias in POV Scheduling
- Symptom: Backtests show implausibly precise POV tracking even when volume suddenly drops, with exceptionally small slippage.
- Cause: When sending a child order in period
, the scheduler uses current-period realized external volume as the denominator, even though the period has not ended. A trader at 09:30 cannot know total market volume from 09:30 to 09:45. - Incorrect code:
# Incorrect: use future current-slot volume to size the current child order
def bad_pov_schedule(parent_q, current_slot_realized_vol, participation_rate):
    target = participation_rate * current_slot_realized_vol
    return math.copysign(min(abs(parent_q), target), parent_q)
- Repair:
# Correct: use only the previous slot's fully settled observed volume
def good_pov_schedule(
    remaining_q, prev_slot_observed_vol, participation_rate
):
    target = participation_rate * prev_slot_observed_vol
    return math.copysign(min(abs(remaining_q), target), remaining_q)
- Numerical implication: If period-
realized volume is far above the previous slot's observed volume, the incorrect scheduler uses hindsight volume in the current request and creates look-ahead bias. The effect on actual prices depends on the price path; this error alone does not establish that the strategy must gain or lose.
12.2 Mistake 2: Charging Cash Twice for Price Impact
-
Symptom: Backtest cash consumption greatly exceeds expectation, and NAV plunges as trading volume grows.
-
Cause: The model computes a fill price
, settles the purchase at , and then deducts an extra impact reserve from cash: -
Incorrect code:
# Incorrect: the fill price includes impact, which is then charged again in cash
fill_price = arrival_price + temporary_impact
cash -= fill_qty * fill_price
cash -= fill_qty * temporary_impact  # Critical error: the impact is charged twice
- Repair:
# Correct: the fill price already includes temporary impact; deduct fill consideration and commission
fill_price = arrival_price + temporary_impact
cash -= fill_qty * fill_price + commission
- Numerical implication: The USD 4,000 in Section 8's TWAP example is the fill-price difference relative to arrival. In the constructed example, spread and temporary impact are zero; the difference comes from the price path and is not an estimate of temporary impact. Double charging would invent an additional USD 4,000 cash loss and severely understate strategy feasibility.
12.3 Mistake 3: Reporting Zero VWAP for No Fills
- Symptom: When an order has no fills, the risk report shows an average fill price of USD 0.00 and later computes a fictitious 100% slippage loss, triggering an alert.
- Cause: The code computes notional divided by volume and avoids division by zero by supplying a default 0.0.
- Incorrect code:
# Incorrect: return 0.0 when there are no fills
vwap = (
    sum(p * q for p, q in fills) / sum(q for p, q in fills)
    if fills
    else 0.0
)
- Repair:
# Correct: no-fill VWAP is mathematically undefined; explicitly return None or math.nan
total_qty = sum(q for p, q in fills)
vwap = (
    sum(p * q for p, q in fills) / total_qty
    if total_qty != 0.0
    else math.nan
)
- Numerical implication: In Section 8.5, no-fill VWAP is undefined, execution slippage is zero, and delay cost of USD 2,000 plus opportunity cost of USD 8,000 yields total shortfall of USD 10,000. If undefined VWAP is replaced by zero and parent quantity
is incorrectly substituted for , execution slippage is miscomputed as , breaking the attribution logic.
12.4 Mistake 4: Misrepresenting Monthly Weights as Intraday Signals
- Symptom: A report attributes the performance of a monthly signal, routed intraday, to the execution algorithm without distinguishing signal-generation frequency from execution frequency.
- Cause: The strategy calculates monthly multifactor weights, such as book-to-market and ROE, from month-end data, but the backtest lets the scheduler time execution from intraday movements. This conflates low-frequency cross-sectional signals with high-frequency execution.
- Repair principle: Keep the architecture in distinct layers:
- Portfolio layer: Update target weights on a monthly or daily clock and generate a static signed parent order
. - Execution layer: Receive the frozen
and schedule child orders on an intraday discrete clock for liquidity tracking and risk control only; do not change the total position or direction unilaterally.
- Portfolio layer: Update target weights on a monthly or daily clock and generate a static signed parent order
12.5 Mistake 5: Extreme Over-Ordering from Ambiguous POV Denominators
- Symptom: A trader sets participation at 20% but mixes inclusive and exclusive denominators, so requests differ from the intended target and may raise execution costs.
- Cause: The exclusive convention is Definition A,
; the inclusive convention is Definition B, . If the trader intends Definition B (20% of all volume) but the code uses Definition A, it requests , an inclusive rate of only . Conversely, if the intended external-volume rate is 20% but the inverse formula is used, the requested child quantity is 25% larger than intended (0.25 rather than 0.20 times external volume). - Repair principle: Put the denominator convention in execution configuration and reports, and unit-test the formula. The Project 4 teaching implementation uses the exclusive denominator. A production interface supporting multiple definitions must validate the selected convention and participation-rate range.
12.6 Mistake 6: Omitting Initial NAV from Maximum Drawdown
-
Symptom: The report shows zero maximum drawdown after a loss in the first evaluation month, or only 10% after two consecutive 10% losses.
-
Cause: It compounds
interval returns into a wealth series but omits initial wealth from the running peak. -
Correct convention: For interval returns
, first construct and , then calculate MDD therefore uses
wealth points, while returns, volatility, and Sharpe continue to use the original interval returns. -
Regression example: MDD is 10% for
; for , wealth falls from 1 to 0.81 and MDD is 19%; a monotonically rising path has MDD 0. Project 4 recomputes this for overall, training, and test windows rather than reusing an old value that happened to be unchanged when the initial point was omitted.
13. Quant Research Application
13.1 End-to-End Institutional Execution Research Pipeline
In a rigorous quantitative investment-management system, execution is not an isolated order-submission script; it connects alpha signals to realized portfolio NAV. Its engineering loop has six causal stages:
+-----------------------+      t_signal       +--------------------------+
| 1. Multifactor research| -----------------> | 2. Portfolio optimization|
| (low-frequency alpha) |                     | (target weights w*)      |
+-----------------------+                     +--------------------------+
                                                        | t_d (decision time)
                                                        v
+-----------------------+      t_parent       +--------------------------+
| 4. Discrete scheduling| <----------------- | 3. Parent-order conversion|
| (TWAP/VWAP/POV)       |    parent received   | (compute signed Q)       |
+-----------------------+                     +--------------------------+
         |
         | t_send → t_venue → t_fill → t_terminal
         v
+-----------------------+                     +--------------------------+
| 5. Cash and position  | -----------------> | 6. Ex-post TCA attribution|
| reconciliation (Q=F+R)|                     | (four-part IS)            |
+-----------------------+                     +--------------------------+
-
Parent-order contract. At decision time
, the portfolio optimizer uses latest NAV and target weight to compute the target share demand for asset : -
Execution-strategy comparison. Stratify orders by
, volatility, spread, time of day, urgency, and risk limit. Compare TWAP, ex-ante forecast VWAP, lagged POV, and other schedules using common benchmarks, cost conventions, and out-of-sample periods. Any routing threshold must be calibrated on relevant order/fill data and tested out of sample; this chapter sets no universal ADV-percentage threshold. -
Post-trade TCA report. After execution, generate an IS attribution dashboard comparing algorithm fill VWAP with external-market VWAP and quantifying how delay, execution slippage, and opportunity cost affect strategy-level performance.
13.2 Benchmark Comparison and Falsification Tests
Evaluation can preregister benchmarks, risk constraints, and falsification criteria to avoid selecting favorable conventions after seeing results:
- Controls may include immediate execution, TWAP, ex-ante frozen forecast VWAP, and lagged POV for the same order and window. Include fees, unfilled opportunity cost, and data latency before comparing IS and risk. A complex algorithm warrants further study only if it adds value against a predefined objective in an out-of-sample interval.
- A capacity stress test may report ranges under a justified set of spreads, impact functions, borrow and financing costs, participation caps, and partial-fill cases. Impact functions and participation caps require calibration on relevant data. Constructed stress scenarios show model sensitivity; they do not prove a paper signal genuine, false, or executable.
14. Chapter Summary
This chapter addresses how to turn a portfolio's signed parent order into market fills safely and efficiently. It develops a complete framework from clock separation and scheduling through impact modeling and IS attribution.
The main conclusions and decision rules are:
- Causal time is essential. The data model and ledger must keep signal, decision, arrival, send, fill, and terminal-mark times distinct. Feeding future realized volume or ex-post market VWAP into the current child-order request is look-ahead bias.
- Schedules answer different questions. TWAP allocates target quantity over time; forecast VWAP uses a volume curve frozen in advance; POV adjusts the request using a declared volume denominator and observations available at send time. Under constant-volatility and impact assumptions, the Almgren–Chriss mean-variance model trades expected cost against execution risk; its trajectory is not a universal prescription.
- IS aligns fills and missed quantity. Implementation shortfall places the decision-to-arrival move, fill prices, terminal value of unfilled quantity, and explicit fees in one monetary framework. This chapter's four components are algebraically identical to the direct-amount method, but empirical comparisons must still state benchmark prices, windows, and fee conventions.
- Boundary handling determines engineering robustness. If a price limit or exhausted liquidity results in no fills (
), fill VWAP is mathematically undefined. Store NaN/None and use opportunity cost to capture the economic performance of the missed trade.
15. Exercises
36-E01 (Conceptual Understanding: Sign Symmetry of Implementation Shortfall)
At 09:30, a quantitative hedge-fund manager decides to sell 20,000 shares of a stock (signed parent order
Use the signed four-component IS decomposition to calculate delay cost, execution cost, opportunity cost, explicit commission, and total IS. Verify the economic meaning of the signs.
36-E02 (Hand Check: TWAP and Forecast-VWAP Schedules)
A trader must buy
Calculate by hand:
- The TWAP child requests in all three slots and the final fill VWAP.
- The forecast-VWAP child requests in all three slots and the final fill VWAP.
- Explain why, in a monotonically rising price environment, forecast VWAP has a worse fill VWAP than TWAP.
36-E03 (Conceptual Analysis: POV Denominators and Extreme Behavior)
Consider the two POV denominator conventions:
- Definition A (exclusive denominator):
. - Definition B (inclusive denominator):
.
Answer the following:
- If the target participation rate is
and previous observed external volume is 40,000 shares, calculate the current child request under each definition. - Prove that under Definition B, the uncapped reference request diverges as
when external volume is positive. Explain why the actual finite request differs, and identify the practical market constraint behind this behavior.
36-E04 (Boundary Derivation: IS and VWAP Status with No Fills)
A quantitative market-making strategy submits a buy limit parent order for
- State the status of fill VWAP
and explain why it cannot be set to 0.00. - Calculate the four IS components step by step. Verify that total IS exactly matches the direct amount
.
36-E05 (Mathematical Derivation: Risk-Neutral Limit of Almgren–Chriss)
In the Almgren–Chriss (2000) mean-variance liquidation model, the objective is
- Write the discrete Euler–Lagrange difference equation.
- Prove rigorously that as trader risk aversion
, the analytic solution degenerates to a constant-speed linear liquidation path (TWAP).
16. Programming Exercises
36-P01 (Programming Exercise: Causal Adapter for the Shared Execution Engine)
Write a thin adapter run_teaching_order(...) that accepts a parent order, algorithm name, time slots, configuration, terminal price, and terminal time; calls quant_course.execution_costs.execute_order; and returns the result. Do not duplicate TWAP, VWAP, POV, or fee algorithms in the chapter or Project directory.
Tests should cover:
; for POV, the first child request is zero when no prior observation exists. - For a slot
, perturb only its realized external volume and that of later slots while holding forecast volume and pre-send observed volume fixed. The request for child order must not change in response to that future-volume perturbation. The realized fill may change. - For forecast VWAP, keep the frozen forecast curve fixed and change realized volume. The current sent request must not read the current slot's future volume; later requests may legitimately change due to prior actual fills and remaining quantity.
- With a zero participation-capacity limit, there are no fills and fill VWAP is undefined.
36-P02 (Programming Exercise: Shared IS-Ledger Adapter)
Write a thin adapter reconcile_order(parent_order, fills, terminal_price) that derives the remainder from the signed parent order and fills, then calls quant_course.execution_costs.compute_is_decomposition.
Tests should include buys, sells, partial fills, and no fills. Check
17. Challenge Problems
36-C01 (Open Derivation: Optimal Execution Speed with a Decaying Signal)
Let
- Write the expected execution-cost and variance functionals relative to the decision price. Let
, and explain why total permanent impact does not depend on the schedule for a monotone completed path. - Derive the Euler–Lagrange equation for the schedule-dependent objective. Using
, give an equivalent objective that is convenient for variation. - For
and , derive the analytic solution satisfying both endpoint constraints, where . Also give the resonance solution for and the branch for . - Compare the effects of signal decay, total signal area, risk aversion, and a speed cap on how front-loaded the schedule is. Do not interpret a boundary-layer solution without a speed cap as an executable instantaneous trade.
- To isolate the signal effect, fix two buy paths with the same endpoints and let
. Under fixed peak drift and, separately, fixed finite-horizon signal area , derive the derivative of the signal-reward difference . Explain whether this implies a global reversal of the optimal speed.
36-C02 (Model Problem: Dark-Pool Fill Probability, Adverse Selection, and Routing Threshold)
Let the buy parent order have size
- Write expected cost
and derive the condition under which some dark-pool routing is cheaper than sending the entire order to the lit venue. - Suppose
is nonincreasing and is nondecreasing as the share of informed traders rises. Explain how the dark-pool advantage changes, and derive the threshold at which the corner solution becomes . Identify an additional mechanism that could produce an interior solution. - Give two engineering implications, distinguishing model thresholds from quantities that require calibration on real fill data.
18. Solutions / Solution Hints
36-E01 Answer
-
Inputs.
- Signed parent order:
shares (sell). - Decision price:
. - Arrival price:
. - Fill quantity and average price:
shares, . - Unfilled remainder:
shares. - Terminal mark:
. - Commission:
/share.
- Signed parent order:
-
Four components.
-
Delay cost:
The price fell by USD 0.20 in the five minutes between decision and order submission, worsening the sale benchmark and creating USD 4,000 in delay cost.
-
Execution cost:
The 15,000 shares filled another USD 0.30 below arrival price. The product of two negative terms is positive, recording USD 4,500 in slippage cost.
-
Opportunity cost:
The unfilled 5,000 shares were not sold at USD 49.80, and the closing price fell further to USD 49.00. The missed chance to avoid this USD 4,000 mark-to-market loss is recorded as opportunity cost.
-
Explicit commission:
. -
Total IS:
.
-
-
Direct-amount check:
The methods agree. All components are positive and measure the amount received less than under the paper target of selling the full order at decision price. A sell order can reduce a long holding; it is not the PnL of a short strategy. An existing short position could instead benefit from a price decline.
36-E02 Answer
-
TWAP schedule and average price.
-
There are
slots and parent quantity shares. -
Each requested quantity is
shares. -
Fill VWAP:
-
-
Forecast-VWAP schedule and average price.
-
Total forecast volume is
shares. -
Weights are
. -
Requested quantities:
shares. shares. shares.
-
Fill VWAP:
-
-
Economic interpretation. In these constructed monotonically rising prices, buying earlier lowers the arithmetic average price. Forecast VWAP schedules 50% of the order in slot 3, so its average of USD 20.3667 is above TWAP's USD 20.3000. This example distinguishes benchmark tracking from timing cost; it does not establish a performance ranking for other price paths.
36-E03 Answer
-
Child requests under each definition.
-
Definition A (exclusive denominator):
-
Definition B (inclusive denominator):
-
-
Singularity and market constraint. Under Definition B,
. Solving for gives . When external volume is positive and the request is not capped by the parent remainder, as , so . The inclusive denominator means “our quantity as a share of external plus our own volume.” With , a finite child order cannot attain ; it can only approach it as quantity grows without bound. Capping at finite parent remainder keeps the actual request finite and may prevent it from attaining the target rate. Engineering systems should impose finite limits from order remainder, risk policy, and market capacity; the equation itself does not imply a 50% threshold.
36-E04 Answer
-
Fill VWAP status. Since cumulative filled quantity is
, the denominator of the weighted-average price is zero. Thus is mathematically undefined. The system must represent it as None or math.nan. Never assign 0.00; later analyses could misread that as buying the stock for zero and report nonsensical profit or loss. -
Four-component calculation and check.
-
Remainder:
shares. -
Delay cost:
-
Execution cost: sum over the nonzero-fill set
. With no fills, and the empty sum is defined as USD 0.00. Do not construct an undefined fill VWAP or write . -
Opportunity cost:
-
Explicit fees:
. -
Total IS:
. -
Direct-amount check:
The totals agree exactly. Under this chapter's convention, when there are no fills the full difference from the decision-price paper target falls into delay and opportunity cost. These are benchmark-attribution components, not cash deductions.
-
36-E05 Answer
-
Discrete Euler–Lagrange equation. In the Almgren–Chriss model:
For an interior node
, , the stationary condition is Rearranging gives the discrete Euler–Lagrange equation:
-
Limit as
. The coefficient tends to zero, and the difference equation becomes Thus the first difference, and equivalently the shares liquidated per slot
, is constant: . With boundary values and , summing gives , hence . The remaining inventory is Therefore, when the trader assigns no weight to price risk (
), minimizing expected temporary-impact cost yields constant-speed liquidation, or TWAP. This proves the limit.
36-P01 Reference Implementation and Tests
from dataclasses import replace
from quant_course.execution_costs import execute_order


def run_teaching_order(parent_order, algorithm, slots, config, terminal_price, terminal_time):
    return execute_order(
        parent_order, algorithm, slots, config,
        terminal_mark_price=terminal_price,
        terminal_mark_time=terminal_time,
    )


# Execute Section 9 first; reuse its parent, slots, config, dt and terminal mark.
result = run_teaching_order(parent, "POV", slots, config, 101.00,
                            slots[-1].slot_end)
assert result.signed_parent_quantity == result.signed_filled_quantity + result.signed_remainder_quantity
assert result.child_orders[0].signed_quantity == 0.0

# Current-slot realized volume affects fills, not the already-sized child request.
perturbed = [slot if slot.slot_index < 1 else
             replace(slot, realized_external_volume=slot.realized_external_volume * 3)
             for slot in slots]
result_perturbed = run_teaching_order(parent, "POV", perturbed, config, 101.00,
                                      slots[-1].slot_end)
assert result.child_orders[0].signed_quantity == result_perturbed.child_orders[0].signed_quantity
assert result.child_orders[1].signed_quantity == result_perturbed.child_orders[1].signed_quantity

# In this nonbinding-capacity example all requests match; this is not a universal claim.
vwap = run_teaching_order(parent, "VWAP", slots, config, 101.00,
                          slots[-1].slot_end)
vwap_perturbed = run_teaching_order(parent, "VWAP", perturbed, config, 101.00,
                                    slots[-1].slot_end)
assert [c.signed_quantity for c in vwap.child_orders] == [
    c.signed_quantity for c in vwap_perturbed.child_orders
]

# A binding capacity case: current request is unchanged; later catch-up may change.
low = replace(config, max_participation=0.02)
base = run_teaching_order(parent, "VWAP", slots, low, 101.00, slots[-1].slot_end)
changed_slots = [replace(slots[0], realized_external_volume=70_000), *slots[1:]]
changed = run_teaching_order(parent, "VWAP", changed_slots, low, 101.00, slots[-1].slot_end)
assert base.child_orders[0].signed_quantity == changed.child_orders[0].signed_quantity
assert base.fills[0].signed_quantity != changed.fills[0].signed_quantity
assert base.child_orders[1].signed_quantity != changed.child_orders[1].signed_quantity

# Zero capacity participation produces no fills and an undefined fill VWAP.
zero_config = replace(config, max_participation=0.0)
zero = run_teaching_order(parent, "VWAP", slots, zero_config, 101.00,
                          slots[-1].slot_end)
assert zero.signed_filled_quantity == 0.0 and zero.fill_vwap is None
In the first example, when capacity is not binding all VWAP requests happen to remain equal; the added low-capacity example is what distinguishes a current request that does not read future volume from later requests that may catch up lawfully. The shared engine's tests/test_execution_costs.py also contains volume-perturbation and VWAP-forecast-isolation tests. This adapter calls only the shared implementation.
36-P02 Reference Implementation and Tests
from dataclasses import replace
from quant_course.execution_costs import compute_is_decomposition, execute_order


def reconcile_order(parent_order, fills, terminal_price):
    filled = sum(fill.signed_quantity for fill in fills)
    remainder = parent_order.signed_quantity - filled
    return compute_is_decomposition(parent_order, fills, remainder, terminal_price)


# Execute Section 9 and P01 first. A genuinely partial buy uses a 2% capacity cap.
partial_config = replace(config, max_participation=0.02)
buy = run_teaching_order(parent, "VWAP", slots, partial_config, 101.00,
                          slots[-1].slot_end)
assert [fill.signed_quantity for fill in buy.fills] == [700, 500, 400, 400]
assert buy.signed_filled_quantity == 2_000
assert buy.signed_remainder_quantity == 8_000
buy_is = reconcile_order(parent, buy.fills, buy.terminal_mark_price)
assert abs(buy_is.explicit_fees - 10.00) < 1e-9
assert abs(buy_is.identity_discrepancy) < 1e-9
assert buy_is.explicit_fees == sum(fill.commission for fill in buy.fills)

sell_parent = replace(parent, order_id="teaching-sell", signed_quantity=-5_000,
                      decision_price=100.40, arrival_price=100.20)
sell = execute_order(sell_parent, "TWAP", slots, config,
                     terminal_mark_price=101.00,
                     terminal_mark_time=slots[-1].slot_end)
sell_is = reconcile_order(sell_parent, sell.fills, sell.terminal_mark_price)
assert abs(sell_is.identity_discrepancy) < 1e-9

no_fill = reconcile_order(parent, [], 101.00)
assert no_fill.fill_vwap is None
assert no_fill.explicit_fees == 0.0
assert abs(no_fill.identity_discrepancy) < 1e-9
In the constructed 2% capacity case, the fills are 700, 500, 400, and 400 shares:
36-C01 Reference Argument and Rubric
Reference Derivation
Let
Integration by parts gives
Set
For
A general solution is
where
which satisfies both endpoints.
At resonance,
Then take
When
If
To compare the signal effect alone, fix two candidate inventory paths and let
For the same early-inventory difference, faster decay therefore reduces capturable signal reward. Under a fixed peak, the finite-horizon signal area
With fixed finite-horizon signal area
Then
Here
Rubric
Correctly state
36-C02 Reference Argument and Rubric
Reference Argument
Under linear per-share costs, expected cost is
Relative to routing the full order to the lit venue, the per-share cost difference on the dark-routed quantity is
Thus
Adding dark-pool capacity, venue-interaction impact, or nonlinear fill probabilities can produce an interior optimum.
In engineering, estimate fill probability, conditional slippage after a fill, the cost of rerouting failures, and venue fees using information available at the same decision time. Validate routing thresholds by asset, time, and order type, and report them alongside unfilled-order risk and urgency. Toxicity metrics and timeout rules may be candidate features or controls, but should not be treated as effective signals without sample validation.
Rubric
Clearly define the cost model and routing share (25 points); derive the correct
19. Further Reading
To guide readers at different stages, the literature in this chapter is grouped into four levels.
Essential
- Perold, A. F. (1988). The Implementation Shortfall: Paper vs. Reality. The Journal of Portfolio Management, 14(3), 4–9. JPM publisher record. Further reading: the historical check verifies author and publisher metadata only, not the full text or specific sections. The teaching decomposition is this chapter's stated convention.
- Almgren, R., & Chriss, N. (2000). Optimal Execution of Portfolio Transactions. Journal of Risk, 3(2), 5–39. Reading focus: the discrete-time price-evolution equation in Section 2 and the efficient-frontier derivation in Section 3. Work through the discrete variational derivation for temporary and permanent impact.
Recommended
- Busseti, E., & Boyd, S. (2015). Volume Weighted Average Price Optimal Execution. Stanford manuscript. Reading focus: the distinction between a static schedule fixed before trading and a dynamic schedule updated with live intraday information, including the convex-optimization approach when total market volume is random.
- U.S. Securities and Exchange Commission (SEC, 2003). Request for Comments on Measures To Improve Disclosure of Mutual Fund Transaction Costs, Release Nos. 33-8349, 34-48952. Reading focus: the regulator's public request for comments on measuring hidden mutual-fund transaction costs, including the debates and evolving boundaries of implementation-shortfall definitions and disclosure.
Advanced
- Cesari, R., Marzo, M., & Zagaglia, P. (2012). Effective Trade Execution: A Review of Algorithmic Trading. Working paper, arXiv:1206.5324. Reading focus: engineering implementations of TWAP, VWAP, and POV in European and US markets, and variational solutions under different impact functions.
- Huberman, G., & Stanzl, W. (2004). Price Manipulation and Quasi-Arbitrage. Econometrica, 72(4), 1247–1275. Publisher page. Reading focus: conditions for excluding quasi-arbitrage under their time-independent price-update framework. The abstract distinguishes permanent and temporary impact; do not restate it as an unconditional empirical law.
Optional
- Kyle, A. S. (1985). Continuous Auctions and Insider Trading. Econometrica, 53(6), 1315–1336. Reading focus: the microstructure model in which informed traders transmit order flow to a market maker through discrete or continuous orders (Kyle's lambda).
- Frazzini, A., Israel, R., & Moskowitz, T. J. (2012). Trading Costs of Asset Pricing Anomalies. AQR working paper. Reading focus: empirical tests using nearly one trillion dollars of real large-hedge-fund trading records to study execution capacity and turnover limits for factors such as momentum and value.
20. References
The core academic and official regulatory sources cited in this chapter correspond to entries in references.md and references/sources.json. Each citation states its scope and limits:
- ALMGREN_CHRISS_2000:
- Citation: Robert Almgren and Neil Chriss, “Optimal Execution of Portfolio Transactions,” The Journal of Risk, 3(2), 5–39 (2000). DOI: 10.21314/JOR.2001.041.
- Supports: Sections 4, 6.2, 10, and 15 on the mean-variance efficient execution frontier and the discrete derivation with linear permanent and temporary impact.
- Scope: The text uses only a teaching simplification under driftless random-walk and constant-volatility assumptions; the closed-form solution is not a guarantee of best execution in real markets.
- BUSSETI_BOYD_VWAP:
- Citation: Enzo Busseti and Stephen Boyd, “Volume Weighted Average Price Optimal Execution,” Stanford University manuscript (2015). Paper page.
- Supports: Sections 5.3 and 5.4, which strictly distinguish static forecast-volume weighting from the ex-post external-market VWAP benchmark.
- Scope: The paper distinguishes static solutions from intraday adaptive solutions. Its NYSE empirical results are literature context only, not empirical output from this course's teaching simulation.
- CESARI_MARZO_ZAGAGLIA_2012:
- Citation: Riccardo Cesari, Massimiliano Marzo, and Paolo Zagaglia, “Effective Trade Execution: A Review of Algorithmic Trading,” arXiv preprint arXiv:1206.5324 (2012). arXiv record.
- Supports: Sections 5, 7, and 19 on the evolution and classification of TWAP, VWAP, and POV in institutional trading.
- Scope: This is a 2012 academic working paper. Its terminology and algorithm review provide academic context; they are not current regulation or a single production standard.
- SEC_IS_2003:
- Citation: U.S. Securities and Exchange Commission, “Request for Comments on Measures To Improve Disclosure of Mutual Fund Transaction Costs,” Release Nos. 33-8349, 34-48952, IC-26313 (2003). SEC document.
- Supports: Sections 5.6, 6.1, and 19 on implementation shortfall in mutual-fund transaction-cost disclosure and the boundaries of its components.
- Scope: This official request for comments reflects regulatory discussion of hidden transaction-cost measurement; it is not a current, uniformly binding legal formula for execution algorithms.
- AQR_COST:
- Citation: Andrea Frazzini, Ronen Israel, and Tobias J. Moskowitz, “Trading Costs of Asset Pricing Anomalies,” AQR Capital Management working paper (2012). AQR paper page.
- Supports: Sections 2, 11, and 13 on estimates of implementation shortfall for large institutional orders and background on turnover constraints to factor capacity.
- Scope: The paper uses historical proprietary execution data from a specific large asset manager. Its empirical cost parameters must not be generalized as universal constants for all securities or teaching strategies.
- HUBERMAN_STANZL_2004:
- Citation: Gur Huberman and Werner Stanzl, “Price Manipulation and Quasi-Arbitrage,” Econometrica, 72(4), 1247–1275 (2004). DOI: 10.1111/j.1468-0262.2004.00531.x.
- Supports: Section 7.3's conditional summary of the abstract: under time-independent permanent price impact, excluding quasi-arbitrage requires linear impact; with temporary impact as well, the abstract requires only a linear permanent component.
- Scope: The publisher record and abstract, plus the abstract and model discussion in the authors' institutional PDF, were checked. The result is not generalized into an empirical law for every market.
- PEROLD_1988:
- Citation: André F. Perold, “The Implementation Shortfall: Paper vs. Reality,” The Journal of Portfolio Management, 14(3), 4–9 (1988). JPM publisher record.
- Supports: Bibliographic identity only: author, title, journal, volume, issue, and pages. It does not support specific chapter passages, teaching definitions, or formulas.
- Scope: The underlying literature check was performed on 2026-10-09; this BIL17A batch inherits that historical bibliographic review of author/publisher metadata, without reading the full text or performing a fresh external source check. The SEC (2003) traces an early source of implementation shortfall to Treynor (1981), so Perold is not described as its originator.