CHAPTER 07/ 45
Statistical Inference: uncertainty in research conclusions
1. Learning goals
After this chapter, you should formulate a question about an unknown population parameter, choose a sample statistic as an estimator, and interpret the realized estimate. You should derive maximum likelihood estimates (MLEs) of mean and variance under independent normal observations; compute and interpret confidence intervals, p-values and testing errors; distinguish bias, variance, consistency and likelihood; choose resampling for temporal dependence; and perform a small Bayesian update with a clear interpretation of each output.
Record the estimand, observation mechanism and test assumptions beside the result before pressing a test button. Prerequisites are Chapter 6’s expectations, conditional probability, LLN and CLT, and Chapter 4’s differentiation. Chapter 8 extends this inference to regression coefficients.
The statistics script uses core functions in statistics_tools.py; the historical course-root Notebook provides an interactive version. Simulations are labeled constructed samples. Actual industry returns use the French snapshot saved in Chapter 2. These illustrate statistical methods without establishing a tradable strategy.
2. Why a quant needs inference
One backtest reports daily mean return 0.03%, another 0.04%. The second is larger, but if it uses only 20 days during which one news story persists, the difference is not automatically a repeatable advantage. Statistics assesses the strength of conclusions supported by finite, noisy observations, rather than making result tables appear precise.
Quantitative research faces variation in the sample mean, possible changes in the generating mechanism, and searches across many versions with only the best retained. Classical intervals mainly address the first. They do not automatically handle regime changes or record discarded experiments.
An interval can describe instability of a fixed rule’s mean estimate under a specified model. Tradability, costs, information availability and whether the rule was frozen in advance still require financial and experimental design. Chapters 22 and 30–32 develop those parts.
3. Intuition
3.1 One historical path, but a sampling distribution asks about repetition
Imagine randomly weighing a batch of apples from a continually replenished supply. The supply’s mean weight is an unknown population parameter; the batch is a sample. Another batch selected by the same rule yields another mean. Calculating this batch’s mean is arithmetic; studying how means change across batches is inference. The analogy explains repeated sampling only. Markets have time-ordered dependence and regime changes, so trading days are not freely exchangeable apples.
A statistic is a function of the sample, such as its mean. For observed data it is a fixed number; before observation it varies with the random sample and has a sampling distribution. Keep these perspectives separate when reading intervals and tests.
3.2 Standard deviation and standard error describe different variation
Return standard deviation describes single-period volatility. Standard error (SE) describes an estimator’s variability across repeated samples. More independent observations reduce the sample mean’s SE, but downloading ten more years does not reduce the market’s daily volatility.
For example, a daily standard deviation of 2% gives a mean SE of about 0.2% across 100 independent observations. Tomorrow’s return does not thereby fluctuate by only 0.2%. Under the specified model, the estimator formed from the 100-day average has sampling variability of about 0.2%.
3.3 Nonsignificance does not establish absence of an effect
High noise and a small sample can hide a small, real mean effect. Failure to reject zero mean means that this test lacks evidence to reject it. Establishing an economically negligible effect instead requires a prespecified tolerance and equivalence or interval-bound analysis; a large p-value alone cannot establish this.
4. Mathematical foundations
4.1 Samples, parameters and estimands
Specify the estimand too: unconditional mean excess return over a period, or a conditional mean in a market state? An average over surviving securities, or the complete contemporaneous population? Match the reported mean to its target, units, window and sampling unit. An API cannot make these choices for you.
4.2 Sample mean and variance
4.3 From IID to dependence: the full sample-mean variance
Without assuming independence, we still have
Here
With absolutely summable autocovariances and suitable weak-dependence assumptions, define long-run variance
5. Definitions
5.1 Bias, variance and mean squared error
Consistency means that an estimator approaches the true parameter in probability as sample size tends to infinity: for any
Unbiasedness concerns expectation at each finite sample size; consistency concerns the limit of an estimator sequence. Neither replaces the other. When adding market observations, ask whether the mechanism needed for that limit still applies.
Bias measures average deviation across repeated samples; variance measures spread across samples; consistency asks whether errors vanish in probability with increasing sample size; MSE combines variance and squared bias in one loss scale. They describe finite-sample center, dispersion, limiting behavior and squared loss respectively.
5.2 Likelihood and maximum likelihood
For IID continuous observations, the likelihood function is
Dependence requires a joint or conditional distribution, for example
Bias, variance and consistency characterize estimators’ average deviations, repeated-sample spread and large-sample convergence. Likelihood compares parameter values’ relative fit for fixed data. Its value is neither a parameter probability nor a description of sampling variability.
5.3 Confidence intervals, tests and errors
An interval procedure
or reaches at least the target level where appropriate.
A hypothesis test specifies null
For this chapter’s two-sided t test, a p-value is the null-model probability of a statistic at least as extreme as observed. It is neither the probability that
5.4 Bootstrap and Bayesian inference
Bootstrap uses observations to approximate an unknown generating distribution and repeatedly recalculates the statistic to approximate sampling variability. Resampling must preserve the structures relevant to the question.
Bayesian inference represents parameter uncertainty with a probability distribution. Prior, likelihood and posterior satisfy
Frequentist inference fixes the parameter and varies data across repeated samples; confidence describes the procedure’s long-run coverage. Bayesian inference assigns posterior parameter probabilities given the model, prior and observed data. Posterior mass and coverage describe different uncertainty objects.
6. Derivations
6.1 Why sample variance divides by
Start with the algebraic identity:
Under IID observations with finite variance, the first right-hand term has expectation
For correlated observations, ddof=1 states a computation convention; it does not prove IID data.
6.2 Gaussian mean and variance MLEs
Assume
Substitute
With a positive squared-deviation sum, profile log-likelihood tends to negative infinity as
Note that
The variance MLE is downward biased but remains consistent under IID observations, finite second moments and the relevant LLN. MLE need not be unbiased; finite- and large-sample properties differ.
6.3 Bias–variance decomposition of MSE
Write the estimation error as
Square and take expectation. The cross term contains
This explains the value of shrinkage. Pulling extreme estimates toward a common center introduces bias, but a sufficiently large variance reduction can lower total error. Chapter 8 uses this in regularized regression and Chapter 21 in covariance shrinkage.
6.4 The t interval for an IID normal mean
Choose critical value
For testing
6.5 Constructing a percentile bootstrap interval
After observing
The empirical distribution approximates the unknown population, and repeated empirical samples approximate the estimator’s sampling variation. Finite-sample bias, skewness, heavy tails, nonsmooth statistics and boundary parameters can impair coverage. Increasing
Independent day-by-day resampling destroys neighboring relationships in a financial sequence. Mean inference then misses temporal covariance’s contribution to SE. Justify an IID approximation before applying independent bootstrap to financial data.
For time series, sample blocks of neighboring observations instead. Here a circular block bootstrap uses fixed length
Asymptotic validity of block methods requires stationarity, relevant moments and sufficiently decaying dependence, among other assumptions. Common results also require
6.6 Beta–Binomial updating
Assume
where
6.7 Power and sample size: detecting a small effect
To examine power, temporarily assume IID Gaussian observations with known single-period standard deviation
Let
For target power
import numpy as np
from scipy import stats

sigma, delta, significance, target_power = 0.02, 0.001, 0.05, 0.80
critical = stats.norm.ppf(1.0 - significance)
required = int(np.ceil((sigma / delta * (critical + stats.norm.ppf(target_power)))**2))
for n in (100, 1000, required):
    power = stats.norm.sf(critical - np.sqrt(n) * delta / sigma)
    print("known-sigma IID Gaussian, one-sided", n, "power", power)
assert stats.norm.sf(critical - np.sqrt(required) * delta / sigma) >= target_power
This design illustration does not use unknown-standard-deviation t power, temporal dependence or multiple testing. Recalculate or simulate under the research model; 2474 is not a universal strategy acceptance threshold.
7. Financial interpretation
7.1 Measure payoffs, not win rate alone
Suppose each win earns 1 unit, each loss loses 2 units, every trade costs 0.1 unit, and success probability is
7.2 Effect size, statistical significance and economic value
Statistical significance assesses incompatibility with the tested hypothesis. Economic value assesses whether an effect warrants costs and risk given capacity.
A daily gross mean of 0.02% with costs 0.03% has a negative net mean even if a large sample estimates the gross mean precisely. A positive mean with a wide interval may instead leave economic value uncertain. Report effect size, interval, cost convention and risk alongside one another; a p-value is not a sole strategy-ranking score.
A mean significantly different from zero also does not remove market beta. Long exposure in a rising market can have a positive mean without independent alpha. Chapters 14–15 specify asset-pricing and factor-regression benchmarks.
7.3 Effective sample size: intuition and scope
For stationary first-order autoregression (AR(1))
8. Numerical Example
8.1 Four returns calculated by hand
8.2 Recorded fixed-seed outputs
The full script uses seed 20261007 and independent child streams for experiments. Forty constructed IID Gaussian observations have model mean 0.002 and standard deviation 0.02. The recorded realization has sample mean about −0.001500, variance MLE about 0.00045812, unbiased variance about 0.00046987, 95% interval
Across 3000 correct-model experiments, 95% t coverage at sample sizes 10, 30 and 100 was about 95.3333%, 94.9333% and 95.5%. A finite simulation need not yield exactly 95%. At true coverage 0.95, the SE of 3000 coverage indicators is approximately
The stationary constructed AR(1) sample contains 240 observations; the first 180 enter estimation, while the final 60 stay out of resampling. With
Finally, prior Beta(2,2) and 6 wins/4 losses give posterior Beta(8,6), with success-probability mean
9. Python Implementation
Default entry point in the accepted reader package
From the accepted I3 reader package root, create the isolated environment described in its README, then run:
.venv/bin/python run_notebook.py notebooks/ch07_statistics.ipynb
This notebook calls the packaged shared implementation, reads no omitted French data and downloads nothing. Each execution writes a unique UUID subdirectory under runs and prints its location. Old production tests and historical course-root commands below belong to the original project; the default reader route is this package-root notebook with its assertions. Optional historical French inputs follow the reader’s data contract; this batch did not rerun them.
Historical course-root route
Run the following self-contained blocks from the course root using the course environment. Each supplies its imports and data. Core functions require one-dimensional finite numeric observations and do not silently discard NaNs, which could change the observation window. Before deleting missing values, investigate dates and causes as in Chapter 3 and record them.
9.1 Check estimates, intervals and tests together
import numpy as np
from scipy import stats
from quant_course.statistics_tools import (
    normal_mle_estimates, mean_t_confidence_interval, one_sample_t_test,
)

sample = np.array([-0.01, 0.01, 0.02, 0.02], dtype=float)
estimates = normal_mle_estimates(sample)
interval = mean_t_confidence_interval(sample, confidence_level=0.95)
test = one_sample_t_test(sample, null_mean=0.0)
assert np.isclose(estimates.mean, 0.01)
assert np.isclose(estimates.variance_mle, 0.00015)
assert np.isclose(estimates.variance_unbiased, 0.0002)
reference = stats.ttest_1samp(sample, popmean=0.0)
assert np.isclose(test.p_value, reference.pvalue)
assert (interval.lower <= 0.0 <= interval.upper) == (test.p_value >= 0.05)
print(estimates)
print(interval)
print(test)
These estimate a single-period mean, not annualized return, with no signal or order time. The interval object’s standard_error is the mean’s SE, not daily-return volatility. SciPy checks computation; you remain responsible for model assumptions.
9.2 Explicit failure for constant or missing samples
import numpy as np
from quant_course.statistics_tools import normal_mle_estimates

constant = np.array([0.01, 0.01, 0.01])
assert constant.var(ddof=0) == 0.0
for invalid in (constant, np.array([0.01, np.nan, 0.02])):
    try:
        normal_mle_estimates(invalid)
    except ValueError as error:
        print(type(error).__name__, str(error))
    else:
        raise AssertionError("invalid input must not produce a regular Gaussian MLE")
A constant sample can have descriptive variance zero, yet no regular Gaussian MLE exists in parameter space
9.3 Resampling that preserves dependence
import numpy as np
from quant_course.statistics_tools import (
    simulate_stationary_ar1, bootstrap_mean_draws,
    moving_block_bootstrap_mean_draws, bootstrap_mean_confidence_interval,
)

streams = [np.random.default_rng(s) for s in np.random.SeedSequence(20261017).spawn(3)]
observations = simulate_stationary_ar1(
    n=240, phi=0.7, innovation_std=0.01, rng=streams[0],
)
train = observations[:180]
holdout = observations[180:]
assert len(holdout) == 60
point_estimate = float(train.mean())
iid = bootstrap_mean_draws(train, n_resamples=2000, rng=streams[1])
blocks = moving_block_bootstrap_mean_draws(
    train, block_length=12, n_resamples=2000, rng=streams[2],
)
for name, draws in (("IID", iid), ("circular fixed blocks", blocks)):
    interval = bootstrap_mean_confidence_interval(draws)
    print(name, "original mean", point_estimate, "interval", interval)
Each method in this block uses 2000 resamples; Section 8’s 4000 belong to the full script. The seeds also differ, so do not tune this output to match Section 8. The percentile-interval function returns estimate as the average of the finite set of resampled means, which can differ slightly from the original mean. Code therefore stores the original mean separately as point_estimate. The standard deviation of Section 8’s 4000 resampled means estimates the original mean’s sampling SE. Do not divide it again by
9.4 Bayesian updating and posterior intervals
import numpy as np
from scipy import stats
from quant_course.statistics_tools import beta_binomial_posterior

posterior = beta_binomial_posterior(
    successes=6, failures=4, prior_alpha=2.0, prior_beta=2.0,
)
a, b = posterior.posterior_alpha, posterior.posterior_beta
credible_interval = stats.beta.ppf([0.025, 0.975], a=a, b=b)
probability_above_half = stats.beta.sf(0.5, a=a, b=b)
expected_net_payoff = 3.0 * posterior.posterior_mean - 2.1
assert np.isclose(posterior.posterior_mean, 4.0 / 7.0)
assert expected_net_payoff < 0.0
print("posterior", posterior)
print("95% equal-tail credible interval", credible_interval)
print("posterior P(p > 0.5)", probability_above_half)
print("posterior expected net payoff, units per trade", expected_net_payoff)
This is a 95% equal-tail credible interval, leaving 2.5% posterior mass at each end. It is neither a frequentist coverage-guaranteed interval nor a highest-posterior-density interval. .sf(0.5) gives posterior probability under the specified Beta–Binomial model and prior, with a meaning different from a t-test p-value.
10. Visualization
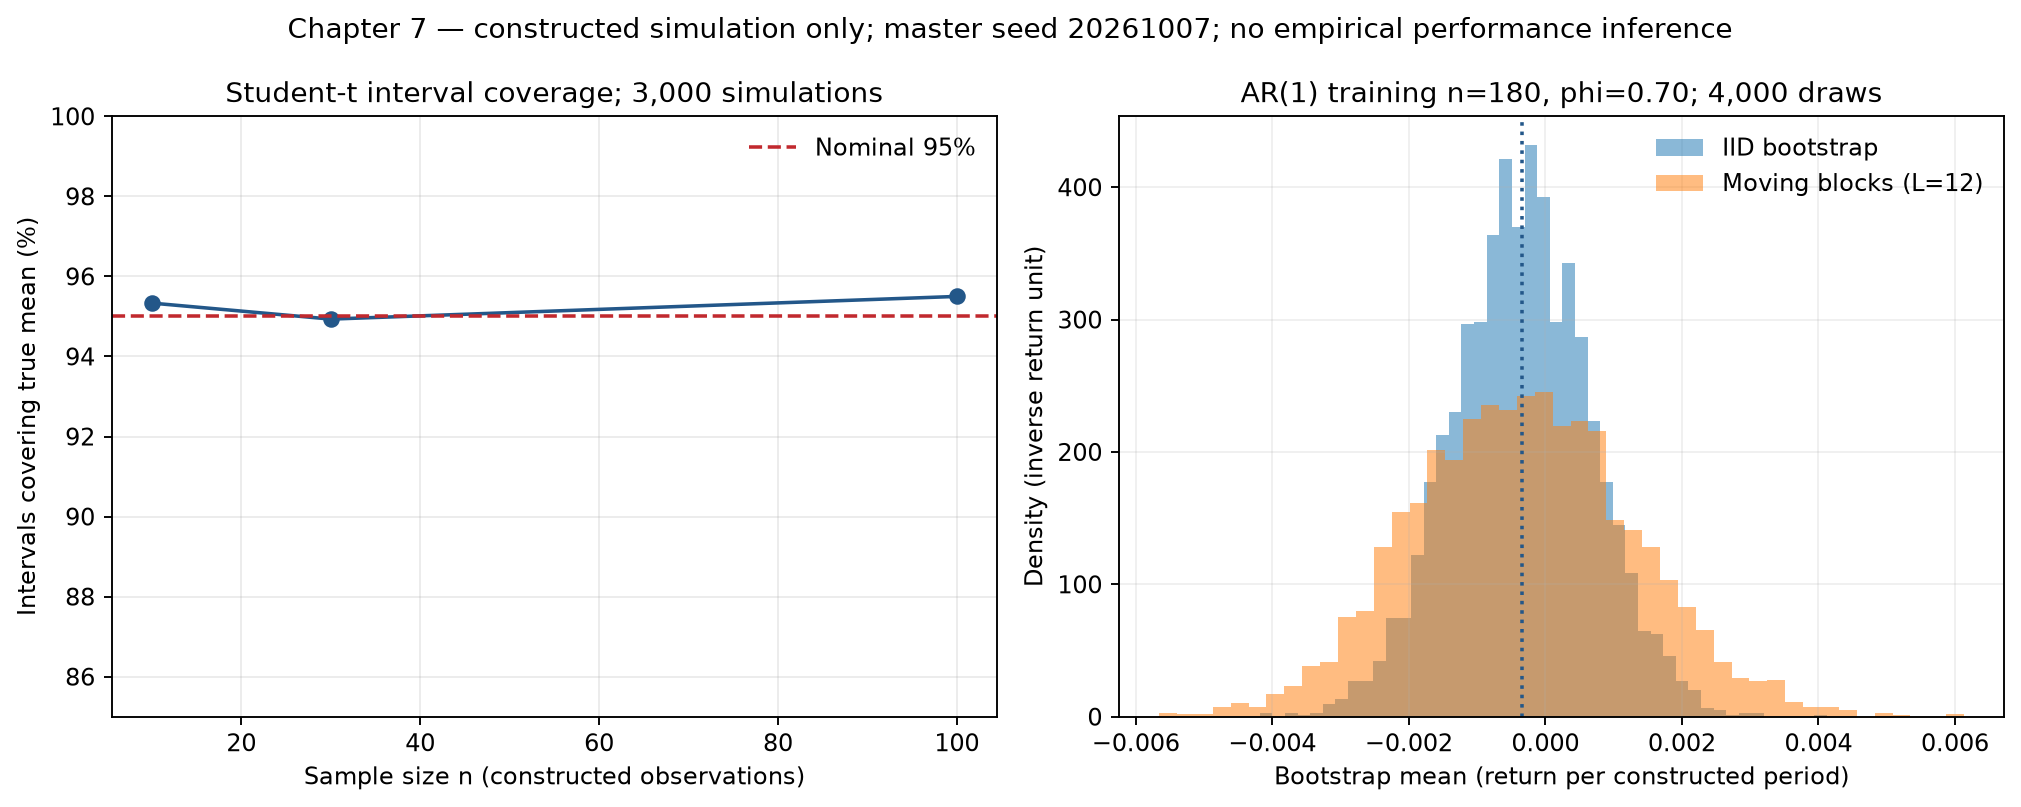
The left panel’s horizontal axis is sample size per simulation and its vertical axis the proportion of 3000 independent experiments covering the true mean. The dashed line is nominal 95%. Observe finite-simulation fluctuations around that level; one point slightly above it does not establish superiority. This checks the specified IID Gaussian experiment, not normality or independence of real returns.
The right panel shows resampled means from the first 180 AR(1) observations, in decimal-return units. Its vertical axis is density, in reciprocal-return units; each histogram has area approximately 1. Blocks are more dispersed in this sample because they retain some positive serial dependence. They include no future 60 observations and use no holdout outcomes to tune block length.
Distinguish raw-return distribution, the mean’s sampling distribution, and the finite-sample bootstrap approximation. The figure shows the third, not a predictive interval for the next return.
11. Real Market Example
Use the saved French 10-industry monthly-return snapshot, prespecify January 2010–December 2019 as the descriptive window, and select Non-durables (NoDur). Fix the range and verify consecutive months before computing mean and an IID reference interval. “Reference” matters: executing code does not establish independent normal observations in this real-market sequence.
from pathlib import Path
import numpy as np
import pandas as pd
from quant_course.statistics_tools import mean_t_confidence_interval

raw = pd.read_csv(
    Path("data/processed/french_10_industries_monthly.csv"), dtype={"month": "string"},
)
monthly = raw.set_axis(pd.PeriodIndex(raw.pop("month"), freq="M"), axis="index")
series = monthly.loc["2010-01":"2019-12", "NoDur"]
expected = pd.period_range("2010-01", "2019-12", freq="M")
assert series.index.equals(expected)
assert np.isfinite(series.to_numpy()).all()
reference = mean_t_confidence_interval(series.to_numpy())
print("published monthly industry snapshot; not a PIT tradable security")
print("n", len(series), "sample mean", float(series.mean()))
print("IID Gaussian reference interval; assumptions unverified", reference)
print("lag-one sample correlation, diagnostic only", float(series.autocorr(lag=1)))
No automatic .dropna() occurs; missing data fail the checks. Monthly labels identify published portfolios’ return months, not proof that data were public at that month-end. The recorded snapshot calculation gave monthly mean about 1.009917%, an IID-reference 95% interval about [0.428369%,1.591465%], and lag-one sample correlation about −0.188911; see the snippet record. These are window-specific calculations, not independence evidence. Near-zero sample lag correlation does not prove independence, and volatility clustering can retain dependence elsewhere. Chapters 16–18 examine serial and volatility structure; Chapter 8 introduces HAC inference.
Industry-portfolio return is not active-strategy excess return, and these data do not subtract the tutorial’s actual trading costs. Record the outputs as descriptive statistics and reference-model calculations for that window, rather than claiming future monthly means will lie between the endpoints. The downloaded version can revise history; point-in-time (PIT) conditions remain unmet. Cache notes record provenance and hashes.
12. Common Mistakes
12.1 Treating a p-value as null-hypothesis probability
An incorrect claim is: “p=0.03 means only a 3% chance that zero returns are true.” Testing assumes the null and calculates a statistic’s tail probability; it supplies no prior or posterior for the hypotheses. Report model, statistic, two-sided rule, p-value, effect estimate and interval.
12.2 Reading a mean interval as tomorrow’s return range
A mean confidence interval estimates a parameter. A prediction interval also includes a new observation’s randomness. More precise mean estimates can coexist with a wide distribution of tomorrow’s return. Confusing the two understates single-period loss risk.
12.3 Treating more bootstrap replications as more data
12.4 Dropping NaNs without reporting selection
Missing crisis-period prices can raise a mean if their dates are deleted. Missingness itself may relate to returns. In financial data, dropna() selects a sample; report removed dates, proportions and causes rather than treating it as an economically neutral cleaning step.
12.5 Reporting one significant result from 100 attempts
Assume 100 independent tests, all null hypotheses true, and each Type I error exactly 5%. Probability of at least one false rejection is
Here 100 counts attempts, not observations. Independence is a demonstration assumption; correlated strategy tests cannot directly use this equality. Even without knowing the total error rate, selecting the smallest p-value and interpreting it as one isolated test changes the research procedure.
import numpy as np
from scipy import stats

rng = np.random.default_rng(20261027)
null_samples = rng.normal(0.0, 1.0, size=(100, 60))
p_values = stats.ttest_1samp(null_samples, popmean=0.0, axis=1).pvalue
raw_rejections = int((p_values < 0.05).sum())
bonferroni_rejections = int((p_values < 0.05 / len(p_values)).sum())
assert bonferroni_rejections <= raw_rejections
print("100 independent null experiments; simulation only")
print("unadjusted rejections", raw_rejections)
print("Bonferroni rejections", bonferroni_rejections)
print("all-null independent probability of at least one raw rejection", 1 - 0.95**100)
Bonferroni correction divides the family’s target level by test count and uses the union bound to control at least one Type I error. It does not require independence, but may be conservative. This example defines the test family in advance. Unrecorded features, windows and universes mean the final 100 retained tests may not be the full attempt count. Chapter 32 covers multiple testing, selection-adjusted performance and overfitting probability.
13. Quant Research Application
13.1 Write an inference contract before experimenting
For a fixed signal’s mean net return, specify population, universe formation, dates, return interval, data availability, execution time, costs, test target, one-/two-sided rule, dependence treatment and parameter-search scope. Freeze splits and record every attempt. These details let a reader identify the question a result addresses.
These pure inference examples create no holdings, so signal_time and trade_time are inapplicable. Strategy returns instead must come from previously specified executable holdings and a cost model. The statistics module does not detect upstream signal leakage; Chapters 29–31 address backtesting and validation.
13.2 A rejection region is not an investment decision
Investment decisions need estimated net effects, uncertainty, tail/liquidity risks and resource constraints. Nonrejection can lead to further data collection; rejection can still lead to stopping because of capacity, exposures or failed replication. Separate statistical outputs from research-team decisions.
A mean-only model does not establish safe extreme drawdowns. Tail observations are scarce, and resampling can repeatedly replay the same few extremes. Chapter 33 develops VaR, Expected Shortfall and stress scenarios.
13.3 Study robustness rather than search for the best p-value
Prespecify reasonable block lengths, economic subperiods and cost scenarios, and report all of them. Trying settings until an interval excludes zero and reporting only that setting creates another parameter search. Sensitivity analysis should explain which assumptions matter, not select the most favorable conclusion.
14. Chapter Summary
Parameters are study targets, statistics are sample functions, and estimates are realized numbers. Unbiasedness, consistency and low MSE address different questions. Variance MLE divides by
Confidence intervals describe procedural coverage and p-values null-model extremeness. Exact t inference requires independent normal observations. Dependence changes sample-mean variance; suitable block resampling or HAC can address some dependence under assumptions and diagnostics. A Bayesian posterior expresses conditional uncertainty differently; posterior win rates still cannot replace net-payoff analysis.
Completion means being able to state an output’s object, units, window, assumptions and interpretation, beyond obtaining a test-function result.
15. Exercises
7-E01 (identify objects). A researcher says an industry’s 120 monthly returns over 2010–2019 average 1%. Identify observations, estimator, estimate and possible estimand. Does the sample mean automatically equal a future population mean?
7-E02 (hand calculation). For
7-E03 (MSE). Two scalar estimators have bias/variance
7-E04 (interval language). Distinguish “95% of parameters lie in this computed interval” from “the procedure covers a fixed parameter in about 95% of repeated samples.” Also distinguish mean intervals and prediction intervals for new returns.
7-E05 (effective sample size). For stationary AR(1) with
7-E06 (multiple tests). For 20 independent true-null tests each at 5%, find the probability of at least one false rejection and the per-test Bonferroni level for family level 5%. Which conclusion does not require independence?
7-E07 (prior and payoff). Update Beta(2,2) with 6 wins and 4 losses. Give posterior distribution and mean. With win payoff 1, loss 2 and cost 0.1, find posterior expected net payoff and the success probability required for positive expectation.
7-N01 (identify objects). Study a fixed rule’s mean daily return over a specified window. Identify unknown population parameter, random variable, realized observation, estimator, estimate and sampling unit. Explain repeated sampling here and the information a sampling mechanism must preserve for neighboring-dependent returns.
7-N02 (one calculation). A prespecified right-sided test observes
7-N03 (complete calculation). Each unit is one independent measurement in common output units. Four IID normal observations are
7-N04 (code diagnosis). A prespecified right-sided normal test uses p = 2 * (1 - Phi(z)). When does this equal a two-sided p-value, and when does it fail? Correct it to a right-tail formula and compute the result using
7-N05 (research judgment). A researcher selects the best of 40 strategy versions and reports IID right-sided
16. Programming Exercises
7-P01 (cross-check computation). Independently generate 80 normal observations with seed 20261037, mean 0.001 and standard deviation 0.02. Calculate a 95% t interval and zero-mean test with the core functions, then cross-check SciPy and assert their two-sided correspondence. Do not make the assertion depend on whether this realization is significant.
7-P02 (block-length sensitivity). With seed 20261047, generate 300 stationary AR(1) observations. Use the first 240 as training and leave 60 unused. For lengths 4, 12 and 24, use independent streams and 2000 circular block resamples, recording intervals and widths. Do not choose block length by zero-mean rejection.
7-P03 (prior sensitivity). Keep 6 wins/4 losses fixed and use Beta(1,1), Beta(2,2) and Beta(10,10). Compute posterior means, 95% equal-tail credible intervals and expected net payoffs. Explain stronger-prior shrinkage toward 0.5 and why interval changes are not additional trading evidence.
17. Challenge Problems
7-C01 (finite-sample dependence). Derive stationary AR(1) mean variance at finite
7-C02 (design coverage experiments). Compare IID t, IID bootstrap and circular length-12 bootstrap coverage under IID Gaussian and stationary AR(1) generation. Specify true mean, sample size, outer replications, bootstrap repetitions, random streams, coverage/width metrics, simulation error and limits for market conclusions. Do not require a preselected winner.
18. Solutions / Solution Hints
7-E01
Observations are the 120 specified monthly industry-portfolio returns. Estimator is
7-E02
Sum 0.04 divided by 4 gives 0.01. Deviations −0.02, 0, 0.01 and 0.01 give squared sum 0.0006. Dividing by 4 gives MLE variance 0.00015, and by 3 sample variance 0.0002. Standard deviation is
7-E03
The first MSE is 0.04 and the second
7-E04
Frequentist parameters are fixed and data/endpoints random; the interval-generating procedure repeats. After observation the interval is fixed, and assigning 95% probability to a fixed parameter needs an additional parameter-probability model. Bayesian posteriors permit parameter probabilities conditional on model and prior. Mean intervals address estimation error; prediction intervals add new-observation randomness and are usually wider. Mechanism changes can invalidate either despite their mathematical form.
7-E05
7-E06
Under independence, probability of at least one error is
7-E07
Posterior is Beta(8,6), with mean
7-P01
The reference implementation follows. Changing seeds may change significance, but computational correspondence should remain.
import numpy as np
from scipy import stats
from quant_course.statistics_tools import mean_t_confidence_interval, one_sample_t_test

sample = np.random.default_rng(20261037).normal(0.001, 0.02, size=80)
interval = mean_t_confidence_interval(sample)
test = one_sample_t_test(sample)
reference = stats.ttest_1samp(sample, popmean=0.0)
assert np.isclose(test.t_statistic, reference.statistic)
assert np.isclose(test.p_value, reference.pvalue)
assert (interval.lower <= 0.0 <= interval.upper) == (test.p_value >= 0.05)
print(interval, test)
Scoring: self-contained data and code; a t statistic using ddof=1; daily-return units; no interpretation of p-values as strategy-validity probabilities.
7-P02
import numpy as np
from quant_course.statistics_tools import (
    simulate_stationary_ar1, moving_block_bootstrap_mean_draws,
    bootstrap_mean_confidence_interval,
)

streams = [np.random.default_rng(s) for s in np.random.SeedSequence(20261047).spawn(4)]
series = 0.001 + simulate_stationary_ar1(
    n=300, phi=0.7, innovation_std=0.01, rng=streams[0],
)
train, holdout = series[:240], series[240:]
assert len(holdout) == 60
for length, rng in zip((4, 12, 24), streams[1:]):
    draws = moving_block_bootstrap_mean_draws(
        train, block_length=length, n_resamples=2000, rng=rng,
    )
    interval = bootstrap_mean_confidence_interval(draws)
    print(length, interval.lower, interval.upper, "width", interval.upper - interval.lower)
Widths need not be monotone. Finite-sample and resampling randomness can change their order. Report all three prespecified settings, explain dependence missed by short blocks and fewer rearrangements with long blocks, and use neither holdout mean nor zero exclusion to select length.
7-P03
from scipy import stats
from quant_course.statistics_tools import beta_binomial_posterior

for prior in (1.0, 2.0, 10.0):
    posterior = beta_binomial_posterior(
        successes=6, failures=4, prior_alpha=prior, prior_beta=prior,
    )
    ci = stats.beta.ppf(
        [0.025, 0.975], a=posterior.posterior_alpha, b=posterior.posterior_beta,
    )
    payoff = 3.0 * posterior.posterior_mean - 2.1
    print("prior", prior, "posterior mean", posterior.posterior_mean, "CI", ci, "payoff", payoff)
Posteriors are Beta(7,5), Beta(8,6) and Beta(16,14), with means about 0.583333, 0.571429 and 0.533333, and expected net payoffs about −0.35, −0.385714 and −0.50. The code computes each interval. A stronger symmetric prior places greater model weight near 0.5. Observations remain the same 10 trials, so narrower intervals do not mean new market evidence.
7-C01
Each lag has
Relative to IID mean variance
import numpy as np

n, phi = 180, 0.7
lags = np.arange(1, n)
finite_ratio = 1.0 + 2.0 * np.sum((1.0 - lags / n) * phi**lags)
long_run_ratio = (1.0 + phi) / (1.0 - phi)
assert finite_ratio > 0.0
print("finite variance ratio", finite_ratio, "SE ratio", np.sqrt(finite_ratio))
print("long-run variance ratio", long_run_ratio, "SE ratio", np.sqrt(long_run_ratio))
Finite-sample variance ratio is about 5.580247 and SE ratio 2.362255; long-run ratios are 5.666667 and 2.380476. Finite samples contain fewer high-lag pairs. This compares mean variances at known parameters, not an exact t reference distribution after estimating dependence.
7-C02
Prespecify, for example, true mean 0.001, target single-period standard deviation and
Record coverage indicators and widths; report coverage mean, average width and simulated-coverage SE
Scoring: model and parameters 20%; original/resampling randomness 20%; coverage, width and simulation error 20%; prespecified methods and complete reporting 20%; interpretation limits 20%. The experiment describes finite-sample behavior under constructed mechanisms; it cannot establish real tradability, stable market mechanisms or future strategy returns.
7-N01
The unknown parameter is fixed-rule mean daily return
7-N02
One-sided p-value is
7-N03
Mean is
Under
Using hand threshold 1.645, power is about
7-N04
The correct standard-normal two-sided expression is 2 * (1 - Phi(z)) matches it only for
7-N05
If 0.03 is the prespecified IID one-sided gross-mean p-value, it describes one right-tail null-model calculation. It neither corrects 40-version selection nor handles serial dependence. With valid costs, the daily net estimate is
Report all 40 versions and their selection rule. If they form a prespecified test family, Bonferroni’s individual threshold is
19. Further Reading
Start with MIT 18.05’s likelihood, normal-data intervals and Bayesian conjugate priors; work two small samples by hand. Then read bootstrap materials, distinguishing interval constructions rather than treating them as one method.
For time-series resampling, read Künsch (1989) and examine dependence, moments and asymptotic block-length assumptions instead of remembering only “blocks are safe.” It is an original-method source, not proof that this circular implementation instantiates all its theorems. Chapters 16–18 provide useful sequence-model foundations first.
The next chapter uses regression for conditional relationships and factor exposures. Chapters 31–32 place individual inference within model selection, multiple attempts and out-of-sample evaluation.
20. References
- MIT 18.05 topics and readings: probability and statistics course structure.
- Orloff & Bloom: Maximum Likelihood Estimates: likelihood and parameter estimation.
- Orloff & Bloom: Confidence Intervals Based on Normal Data: normal mean intervals and interpretation.
- Orloff & Bloom: Conjugate Priors, Beta and Normal: Beta updating.
- MIT 18.05: Bootstrap Confidence Intervals: resampling interval materials.
- SciPy
ttest_1samp, Beta and bootstrap: APIs and conventions; the default interval is not this chapter’s explicit percentile method. - Künsch (1989), The Jackknife and the Bootstrap for General Stationary Observations, The Annals of Statistics, 17(3), 1217–1241, DOI 10.1214/aos/1176347265. Publisher abstract and author publication list were checked; full-text theorems are not claimed as verified here.
- Kenneth French: 10 industry portfolios: source of the real monthly-return cache, not a PIT individual-security trading database.
The chapter source notes record verification scope and program evidence.