CHAPTER 38/ 45
: Financial ML Pipeline
Main thread: Turn “when each feature is known, which returns the label covers, and when the model is fitted” into a contract, then make splitting, preprocessing, tuning, and evaluation follow that contract. Prerequisites: Chapter 23, cross-sectional research (IC, grouping, panels); Chapter 31, model validation (label intervals, purging, embargo, walk-forward); and Chapter 37. After completing this chapter, you will be able to: record signal_time, trade_time, and the label interval for every row in a daily panel; determine by hand which training rows are available at a given fit time; preprocess and tune with a training-only Pipeline; and explain why shuffled K-fold can rate pure-noise features as “effective.”
1. Learning Objectives
- Record six times for every panel row: feature availability (
available_at),signal_time,trade_time,label_start,label_end, andlabel_available_at, and use them to calculate labels by hand. - Prove that, at fit time
, a row with signal date is available for training if and only if ; with no missing data, the last signal dates before the test date are excluded. Explain how this differs from purging based on interval overlap. - Split a panel with date-grouped walk-forward: all asset rows on a date must stay on the same side.
- Distinguish transforms that use only same-day cross-sectional information (no training fit required) from transforms fitted across dates (must be fitted only on training rows); implement the latter with a
Pipeline. - Place hyperparameter selection inside the outer training set and explain why inner folds must follow the same availability rule.
- Report prediction-layer metrics (
, IC, calibration slope) separately from portfolio-layer results (net-of-cost returns, Chapter 39 and Project 6). - Quantify the costs of three incorrect practices with runnable counterexamples: shuffled K-fold, full-sample feature selection, and starting the label at the signal close.
Completion criteria: Sections 15–17 can be completed independently; trace the frozen inputs and outputs in Sections 8–10 and explain the identity boundary between a fresh run of Section 9 and a frozen replay. This batch does not run or retrain.
2. Why Quant Needs This
A researcher brings you the following result: 40 stocks, five years of daily data, and 22 features produce an out-of-sample
The error is often not in the model but in the timing: when a feature becomes available, which period the label covers, and when the model is fitted. This chapter writes those times into a contract and makes every step check it. Chapter 31 introduced label intervals, purging, and walk-forward for a single series. This chapter handles panels (multiple assets on the same date) and the full preprocessing–tuning–evaluation chain, and places the implementation in quant_course.ml_pipeline for Chapter 39 and Project 6 to share.
3. Intuition
Imagine building a model after the close on Monday, March 2. You have all prices through Monday's close and want to predict the return from “buying at tomorrow's close and holding for two days.”
- The sample from the previous Wednesday (
) has a label covering Thursday's close through Monday's close. By Monday's close you have observed it, so this row can be used for training. - The previous Thursday's label runs from Friday's close through Tuesday's close. Tuesday has not arrived, so the row cannot be used.
- The previous Friday's label runs from Monday's close through Wednesday's close. It is also not yet complete.
Thus, even when a sample's signal date is before the model date, its label may not have finished accruing and cannot enter training. Including it lets the model see future returns. The number of excluded dates is determined by “execution lag + holding period,” not by an interval chosen by intuition.
A panel adds another issue: there are 40 stocks on the same date. Their features are available together, and their labels cover the same period. If 20 stocks from March 2 go into training and the other 20 into testing, then at test time the model has already learned from the training stocks that “the market rose after March 2.” The split unit must therefore be the date, not the row.
4. Mathematical Setup
| Symbol | Meaning | Unit / dimension |
|---|---|---|
| Trading dates; each date represents that day's close | date | |
| Asset | — | |
| Execution lag: number of trading days from signal close to execution close | trading days | |
| Prediction horizon (holding period) | trading days | |
| Features for asset |
each feature's own unit | |
| Closing price | currency / share | |
| Label: |
decimal | |
| Label interval (open on the left, closed on the right) | — | |
| Date index of fit time: fit the model after the close on |
— |
Timing convention: signal_time trade_time label_start label_end label_available_at available_at and label_available_at one day later; the derivation below still applies.
Keep dates separate from exact decision times. signal_time records the date of the signal, available_at available_at; execution still occurs at
Intraday clock: snapshot first, then fit, then signal
The following is a standalone teaching construction in the exchange's local time zone. Except for the next-trading-day execution in the last row, all intraday and after-hours events occur on trading date
| Time | Event | Treatment in this fit or signal |
|---|---|---|
| 16:00 | Close; a historical training row's label interval has just ended | Still wait for label ingestion; ending does not mean it can be read |
| 16:08 | The day's price-derived features are ingested | Available to the 16:10 signal; also readable in the 16:09 fit snapshot |
| 16:09 | fit_time: lock the training snapshot and start fitting |
Use only historical features already readable and mature labels |
| 16:09:40 | Fit completes | In time for the signal cutoff; later-arriving data are not added to the fitted model |
| 16:10 | Apply the fitted transform to today's features, ingested at 16:08 | |
| 16:20 | The label that ended at 16:00 above is ingested | After fit_time; it cannot enter this training run |
| 16:30 | Earnings are released (assume they are ingested at the same time) | After |
| Close on |
Execution point for this example with |
The label starts at this execution close, not at 16:10 |
Rows used in this fit have label_available_at no later than 16:09. Rows for the current date, label_end is no later than that day's close.
Three checks guard three gates: training data must be readable by fit_time; prediction features must be readable by
Prerequisites used here: Chapter 31's interval-overlap condition
5. Formal Definitions
Feature and feature availability time (available_at). A feature is a quantity available_at for each feature; it must satisfy available_at available_at equal to the release time, even if the “reporting period” predates the signal date; they cannot be used for that day's signal under the default cutoff (Chapter 12, PIT). This makes “did the feature use the future?” a rule that code can assert.
Feature engineering. The process of constructing features from raw data. There are two types by information source:
- Cross-sectional transform: uses data only from the same signal date, such as that day's cross-sectional ranks, cross-sectional z-scores, or within-industry demeaning (Chapters 23 and 28). It is computed independently on each date, requires no “training fit,” and brings in no information from other dates.
- Pooled / time-series transform: estimates parameters from data across multiple dates, such as full-sample mean–variance standardization, filling missing values with the full-sample median, PCA, feature selection, or quantile-clipping thresholds. Estimate its parameters using training rows only.
Label and prediction horizon. The label
Label availability time (label_available_at). The time when the label value first becomes readable to the training program. In this chapter's daily construction, it is assumed to be available at the same close as label_end; a real system must record the ingestion time instead of assuming equality. It is different from signal_time: an early signal date does not mean the label is already known.
Cross-sectional panel. A long table keyed by (signal_time, asset). Rows with the same signal_time share the same set of timestamps.
Fit time (fit_time) and available training set. Fit the outer fold at the close on fit_time. The date formula below abbreviates label_available_at fit_time as label_available_at
Date-grouped walk-forward. Sort the unique dates. A test block consists of consecutive dates
Purging (excluding by label interval). Chapter 31's purging removes training rows whose label intervals overlap test label intervals. This chapter writes the rule as availability by
Gap and embargo. A gap is an additional set of dates left empty between the end of training and the start of testing. An embargo removes training rows immediately after a test block (when K-fold allows training rows after the test block) if their feature lookback windows cover the test label interval. Both should follow from the data's actual timing structure: the gap follows from label intervals and availability time; embargo length follows from the feature lookback window. Do not replace this with a uniform “leave five days” rule (Section 6.2).
Preprocessing and Pipeline. Preprocessing is a transform across dates applied to features before fitting a model. sklearn.pipeline.Pipeline chains several transforms and an estimator into one object. On fit, each step is fitted in sequence only to the training data passed in; on predict, the fitted parameters transform new data (official documentation SK_PIPE_DOC).
Hyperparameter selection. Choosing quantities such as regularization strength or number of features that are not directly estimated during training. Rule: use only outer-training rows; within those rows, run date walk-forward inner folds, each following the same availability rule; after selection, refit on all outer-training rows and predict the outer test block. Outer-test labels must not enter any fit, standardization, or selection.
Evaluation. Two layers. Prediction layer:
Model calibration. Whether predictions and realized values agree in magnitude. For regression predictions, the calibration slope is SK_CALIBRATION for the classification-probability version).
6. Derivations
6.1 Availability Rule, Number of Excluded Dates, and Its Relation to Overlap Purging
Assumptions: equally spaced date indices; no missing data;
First, the availability condition. The label for signal date
Second, the number of excluded dates. Candidate training dates are
dates, or that number times the asset count
Third, availability implies non-overlap. The earliest test label interval is
Fourth, overlap purging alone is insufficient. The training interval
Use: In implementation, filter each row by label_available_at; the number excluded then follows naturally from the intervals. The row-wise rule still works when dates are missing or assets have different label intervals, whereas “always leave ml_pipeline.date_walk_forward implements this and uses “training and test intervals must not overlap” as a defensive assertion.
A more conservative convention: If labels must be ingested by a close before fit time (label_available_at
6.2 When a Gap or Embargo Is Needed, and How Long It Should Be
Walk-forward (all training is before testing): The availability rule in Section 6.1 already handles labels that cross the boundary; no additional embargo is needed. If the system requires at least trade_time, not in an arbitrary training-row deletion.
scikit-learn's TimeSeriesSplit(gap=g): gap is the number of samples excluded between the end of the training set and the test set (SK_TSS). In a panel, a sample is a row, not a date: with 40 rows per day, gap=5 leaves only one-eighth of a day. Even gap=5*40 becomes misaligned with dates as soon as a stock is missing on any date. Use date rules for panels, not a row-count gap.
Purged K-fold (training blocks may be after the test block): First purge using the real label intervals; future training rows may also overlap test labels and cannot be skipped just because their signal dates are later. Then check the feature windows of the remaining future training rows. If a feature uses the past
Chapter 31's window rule must use its stated coordinates and half-open endpoints. Counted relative to the last label end rev_5 corresponds to five days; mom_60_5 depends on prices as far back as 60 days and can use a conservative 60-day protocol. EMA has no exact finite lookback endpoint, and quarterly variables cannot simply be treated as finite return windows. Walk-forward has no training rows after the test block; label maturity handles the past-side boundary, so there is no future-side embargo.
This chapter's CLI date-block diagnostic actually passes signal-date ordinals and label_end; it purges using the conservative (signal_date, label_end] envelope, not the true (label_start, label_end] interval in this section. The embargo parameter defaults to zero. Its result table is an offline diagnostic, not full feature isolation or deployment evaluation; date_walk_forward separately filters by the true label interval and maturity time.
6.3 Training-Only Standardization: When It Changes Results and When It Does Not
Claim (three levels): With-intercept OLS and training design matrix
- Training fitted values are always unchanged: whether or not
has full column rank, OLS fitted values are the same under the two designs. - A corresponding coefficient representation always exists: any standardized coefficients
can be written in the original coordinates as and . Both representations give the same predictions at every new point. - Predictions at new points: unchanged with full column rank, not guaranteed with rank deficiency: If
has full column rank ( , so , and no feature is an exact linear combination of other features and the intercept), the OLS solution is unique. The solutions under the two designs correspond, so they give the same prediction for every new point . If is rank deficient, the training data do not identify coefficient components in the null-space directions. The software's default solution (scikit-learn LinearRegressionfirst centers using training means to handle the intercept, then returns a minimum-norm slope solution) chooses a different “minimum norm” in the two coordinate systems. Predictions generally differ for new points outside the training data's linear relationships. If a new point satisfies those same linear relationships, the predictions are guaranteed to agree; at other points they may coincide accidentally, but there is no general guarantee.
When reading these three levels, distinguish “changing coordinates for the same coefficient vector” from “letting software solve again.” Level 2 is an algebraic identity that holds at every new point. Level 3 asks whether refitting is guaranteed to select that corresponding coefficient vector. Full column rank ensures uniqueness; rank deficiency ensures only that the training projection is unique. The full-rank condition is on the augmented matrix
Proof: (1)
is invertible, so LinearRegression's minimum-norm solution minimizes slope norm
Rank-deficient counterexample (constructed): Training
import numpy as np
from sklearn.linear_model import LinearRegression
from sklearn.pipeline import make_pipeline
from sklearn.preprocessing import StandardScaler

X = np.array([[1.0, 2.0], [2.0, 4.0], [3.0, 6.0]]); y = np.array([1.0, 2.0, 3.0]); new = np.array([[1.0, 5.0]])
raw = LinearRegression().fit(X, y)
std = make_pipeline(StandardScaler(), LinearRegression()).fit(X, y)
print(np.round(raw.predict(X), 6), np.round(std.predict(X), 6))     # identical training fit
print(round(raw.predict(new)[0], 4), round(std.predict(new)[0], 4))  # 2.2 1.75
Both models have training fitted values
Thus, with full column rank, “standardize using full-sample means and variances” does not affect OLS predictions; with rank deficiency, even OLS can be affected (as above). Standardization can generally affect:
- Ridge and Lasso: the penalty
depends on feature scales, so changing can change the solution (Chapter 39). - kNN and clustering: distances depend on scale.
- Threshold rules, clipping, missing-value imputation, and feature selection: their parameters are estimated from data, so full-sample estimates directly use test-period information.
In this constructed example, feature selection produces substantial leakage. The size of leakage from different preprocessing methods depends on the data and design; this case does not establish a universal ranking. Section 8.3 shows that selecting 10 of 200 pure-noise features by full-sample correlation gives walk-forward Pipeline and must be refitted in each training fold.
6.4 Why Shuffled K-Fold Turns Noise into a Signal
Setup: Features are slow AR(1) variables with daily correlation
After shuffling, the training set almost always contains
A linear model (Ridge) cannot “look up” rows. On the same data, shuffled K-fold gives about
6.5 Decomposing Prediction Error into “Level and Cross-Section,” and Calibration
Assumption: Each date
Derivation:
Financial interpretation: The first term is the error in “guessing how much the whole market will rise this week”; the second is the error in “guessing which asset will do better.” The return of a dollar-neutral portfolio (weights sum to zero) depends only on the information corresponding to the second term. Spearman IC measures only ranks, which are unchanged by demeaning; cross-sectional SSE and cross-sectional
Calibration: A pooled calibration slope
7. Financial Interpretation
A time contract is risk control. If a backtest uses one extra day of future returns, that day does not exist in live trading. Writing every time into the data dictionary lets code check “what did I know at time
Why group by date. Stocks on the same date experience a common market shock. If rows from the same date are randomly split, the model learns that day's market direction from training stocks and “predicts” it for test stocks. At deployment, that information is not available from the signal-date close.
Level and cross-section. Many stock-selection strategies are dollar-neutral: weights summing to zero cancel a common level term in
Tuning instability is information. The Ridge regression in Section 8.4 selects regularization strengths ranging from inner_scores MSE curves and stability; parameter jumps alone do not prove that the curve is flat or identify a unique cause. Treating the model as “very stable” would be a misreading. The variation is a cue to focus on IC stability and portfolio-layer results rather than one particular hyperparameter.
Calibration and trading thresholds. If the rule is “trade only when predicted return exceeds one-way cost,” overly dispersed forecasts (
8. Numerical Example
8.1 Hand Calculation: 3 Assets × 12 Days,
(Teaching construction.) Closing prices:
| 1 | 2 | 3 | 4 | 5 | 6 | 7 | 8 | 9 | 10 | 11 | 12 | |
|---|---|---|---|---|---|---|---|---|---|---|---|---|
| A | 100 | 101 | 103 | 102 | 104 | 106 | 105 | 107 | 110 | 108 | 111 | 112 |
| B | 50 | 50.5 | 50 | 49.5 | 49 | 49.5 | 50 | 51 | 51.5 | 52 | 51 | 52.5 |
| C | 20 | 20 | 20.2 | 20.4 | 20.2 | 20 | 20.4 | 20.6 | 20.6 | 20.8 | 21 | 20.8 |
The label is
| Signal date |
label_end |
|||
|---|---|---|---|---|
| 1 | 0.009901 | −0.019802 | 0.020000 | |
| 2 | 0.009709 | −0.020000 | 0.000000 | |
| 3 | 0.039216 | 0.000000 | −0.019608 | |
| 4 | 0.009615 | 0.020408 | 0.009901 | |
| 5 | 0.009434 | 0.030303 | 0.030000 | |
| 6 | 0.047619 | 0.030000 | 0.009804 | |
| 7 | 0.009346 | 0.019608 | 0.009709 | |
| 8 | 0.009091 | −0.009709 | 0.019417 | |
| 9 | 0.037037 | 0.009615 | 0.000000 | |
| 10–12 | beyond sample | missing | missing | missing |
One fold: Training dates
8.2 Shuffled K-Fold, Date-Block K-Fold, and Walk-Forward (Pure Noise)
Constructed panel: 40 assets, 1,260 trading days, and 22 slow-moving features (AR(1),
| Method | Ridge ( |
kNN (5 neighbors) |
|---|---|---|
| Shuffled 5-fold (incorrect) | +0.05% | +56.67% |
| Date-block purged 5-fold (Chapter 31, diagnostic only) | −0.73% | −43.31% |
| Date walk-forward (11 folds, deployment convention) | −1.65% | −40.73% |
Date-block K-fold removes the “same-stock adjacent-date lookup” caused by shuffling, but training blocks may still come after test blocks, so it does not represent deployment. Walk-forward corresponds to “use only the past.” With pure-noise features, both date-based methods are negative: the model fits noise and performs worse out of sample than the zero forecast.
8.3 Full-Sample Feature Selection (Pure Noise)
30 assets, 756 days, 200 pure-noise features, select 10, Ridge, date walk-forward (seed 3802):
| Method | Mean daily Spearman IC | |
|---|---|---|
| Select by full-sample |
+0.617% | +0.0476 |
Training-set selection inside Pipeline (SelectKBest) |
−1.214% | −0.0101 |
The incorrect method produces an “IC of about 0.05” from pure noise—right in the range Chapter 37 describes as a “real but weak signal,” and difficult to spot by eye.
8.4 Complete Panel Case
Constructed panel: 40 assets, 1,260 days; two real features rev_5, mom_60_5, vol_20);
- Each outer fold excludes 200 rows
, consistent with Section 6.1. In the first outer fold, mom_60_5requires 60 days of history, so 2,400 rows are dropped as missing (). - Selected
values: . - Prediction layer (30,000 test rows, 750 dates):
relative to zero and relative to the training mean; cross-sectional (demeaned within date) ; mean daily Spearman IC 0.0255, Newey–West (lag 4); directional hit rate 49.7%. - Calibration: pooled slope 0.36 (level forecasts are too dispersed), cross-sectional slope 1.18 (cross-sectional forecasts are slightly conservative). By within-date prediction decile, the highest-decile minus lowest-decile mean demeaned five-day return is about
; the middle deciles are nonmonotonic.
Read these numbers using the decomposition in Section 6.5: level error makes pooled
9. Python Implementation
Core module: src/quant_course/ml_pipeline.py (shared by Chapter 39 and Project 6). Main interfaces:
make_forward_labels(close, horizon, execution_lag=1): returns a long table keyed by (signal_time,asset) withtrade_time,label_start,label_end,label_available_at, andy; labels at the end of the sample are missing.date_walk_forward(signal_time, label_start, label_end, label_available_at, *, min_train_dates, test_dates, step=None, expanding=True, max_train_dates=None): date-grouped walk-forward; training rows satisfylabel_available_atfit_time; recordsn_excluded_unavailable. It does not accept the real vendor featureavailable_at; the caller remains responsible for point-in-time feature versions and the exact fit snapshot. RaisesRuntimeErrorif training and test intervals overlap.fit_select_predict(...)/walk_forward_predict(...): a Pipeline withStandardScalerand a linear estimator; selects hyperparameters using inner date walk-forward (minimum mean validation MSE; ties go to the earlier grid value); includeszeroandtrain_meanbaselines.prediction_metrics(labels, pred, horizon, train_mean_pred=None):(relative to zero and the training mean), IC (reuses Chapter 23's ic_series/ic_summary,nw_lags=h-1), and hit rate.simulate_return_panel,price_features,stack_features: construct the panel and features (for teaching).
Missing-data policy: Drop and count training rows with missing features or labels; do not predict and count test rows with missing features; raise an error if inf occurs.
Chapter script: code/ch38_ml_pipeline.py. The historical working script's default figure path may overwrite chapter figures; do not run it to validate the frozen values. The accepted I3 reader Notebook performs fresh constructed calculations, writes to a unique run directory, and generates one label-timeline figure; its English-language layer is deferred to BIL23. This batch did not run the CLI, Notebook, or course API.
Seeds 3801–3803; outputs ch38_results.json (refuses to overwrite) and three figures. The “incorrect” practices in Sections 8.2 and 8.3 are used only to measure bias; the code marks them WRONG, and they are never used to select a model. Tests: tests/test_ml_pipeline.py (22 cases, including row-by-row boundaries, future-data perturbation, test-label perturbation, missing values, and integration with the Chapter 29 ledger).
The hand-worked example can be reproduced as follows:
import pandas as pd
from quant_course import ml_pipeline as mp

close = pd.DataFrame({
    "A": [100, 101, 103, 102, 104, 106, 105, 107, 110, 108, 111, 112],
    "B": [50, 50.5, 50, 49.5, 49, 49.5, 50, 51, 51.5, 52, 51, 52.5],
    "C": [20, 20, 20.2, 20.4, 20.2, 20, 20.4, 20.6, 20.6, 20.8, 21, 20.8],
}, index=pd.bdate_range("2026-03-02", periods=12), dtype=float)
labels = mp.make_forward_labels(close, horizon=2, execution_lag=1)
fold = mp.date_walk_forward(labels.index.get_level_values(0), labels["label_start"], labels["label_end"],
                            labels["label_available_at"], min_train_dates=6, test_dates=3)[0]
used = sorted({close.index.get_loc(d) + 1 for d in labels.index.get_level_values(0)[fold.train_rows]})
print(round(labels.loc[(close.index[0], "A"), "y"], 6), used, fold.n_excluded_unavailable)
Expected output: 0.009901 [1, 2, 3, 4] 6.
10. Visualization
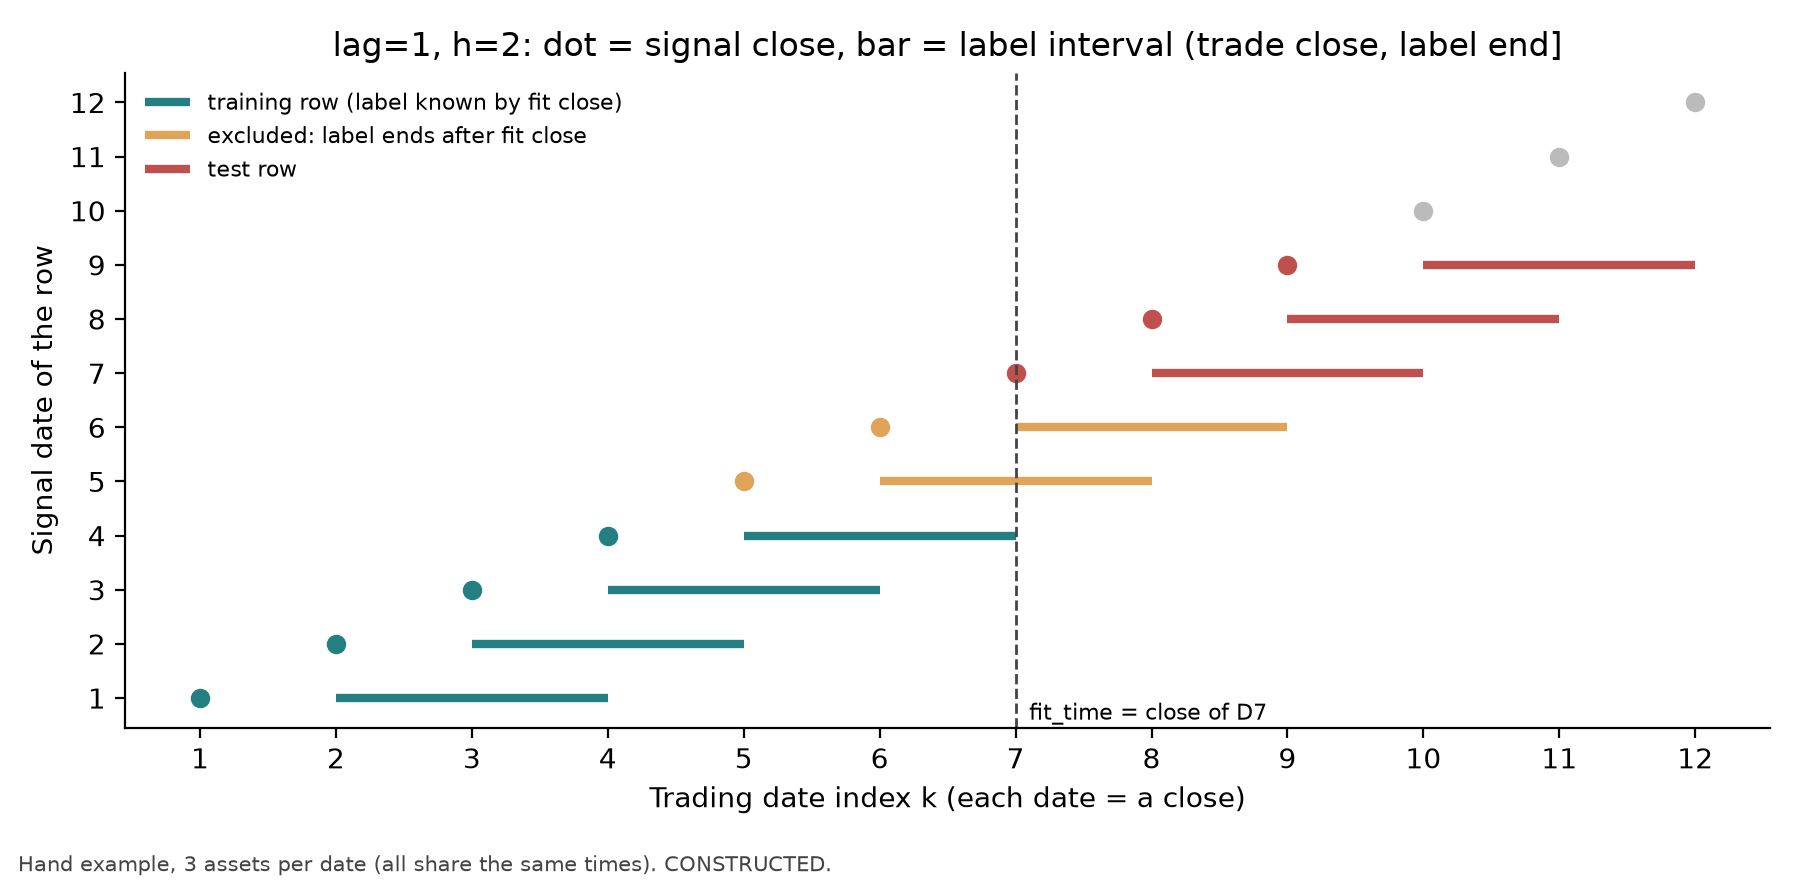
Figure 38-1: The horizontal axis is trading-date index
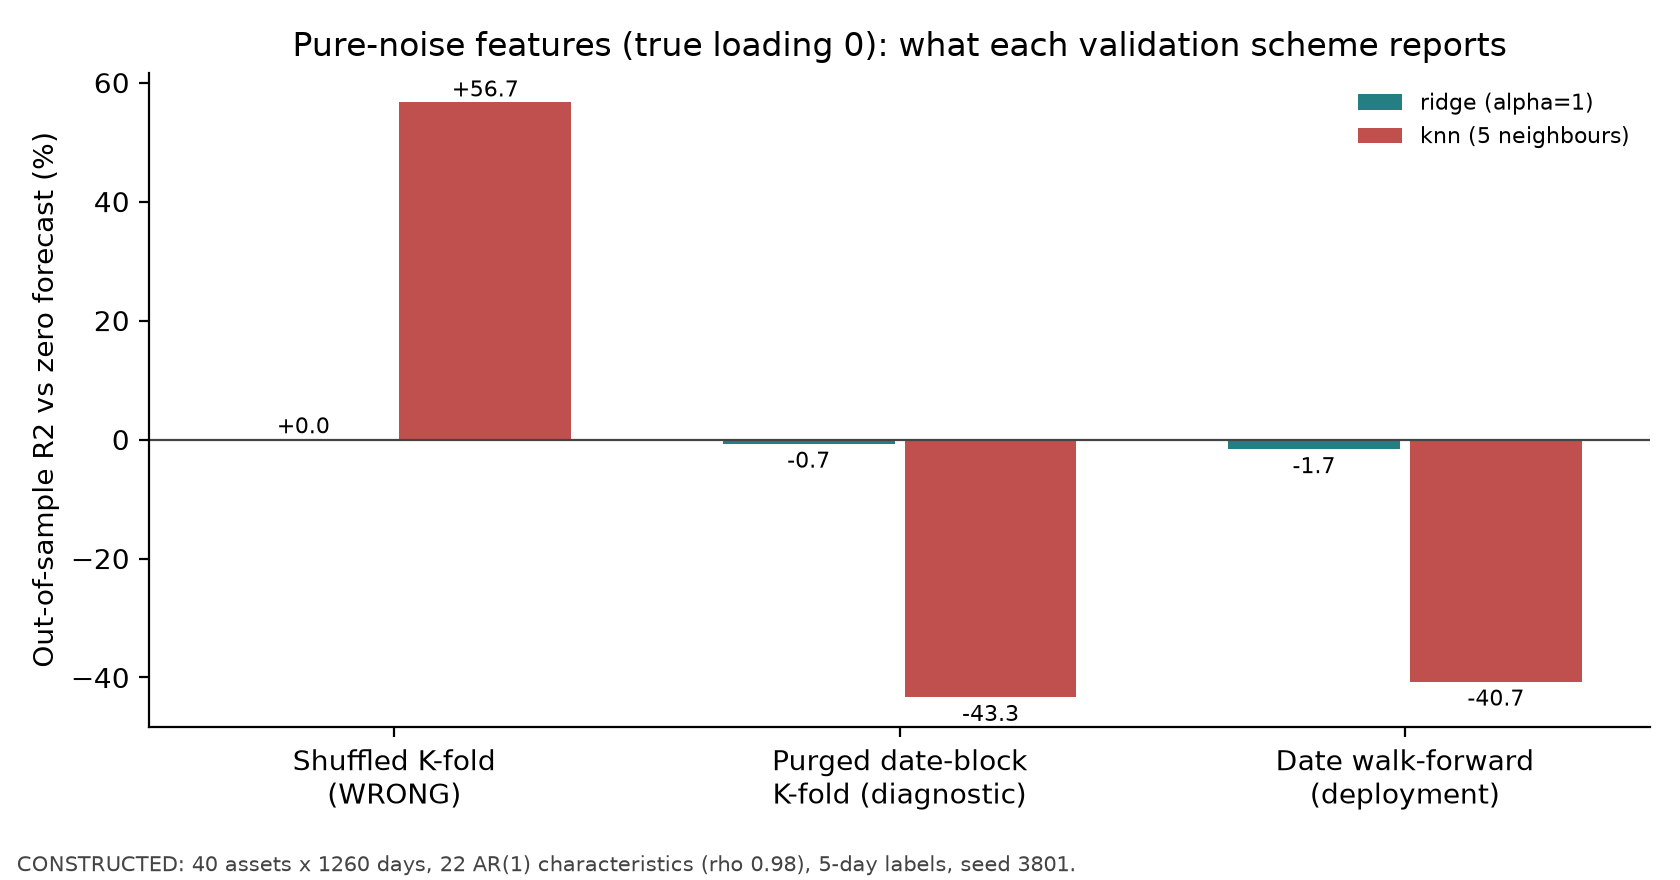
Figure 38-2: The horizontal axis shows three validation methods; the vertical axis is out-of-sample
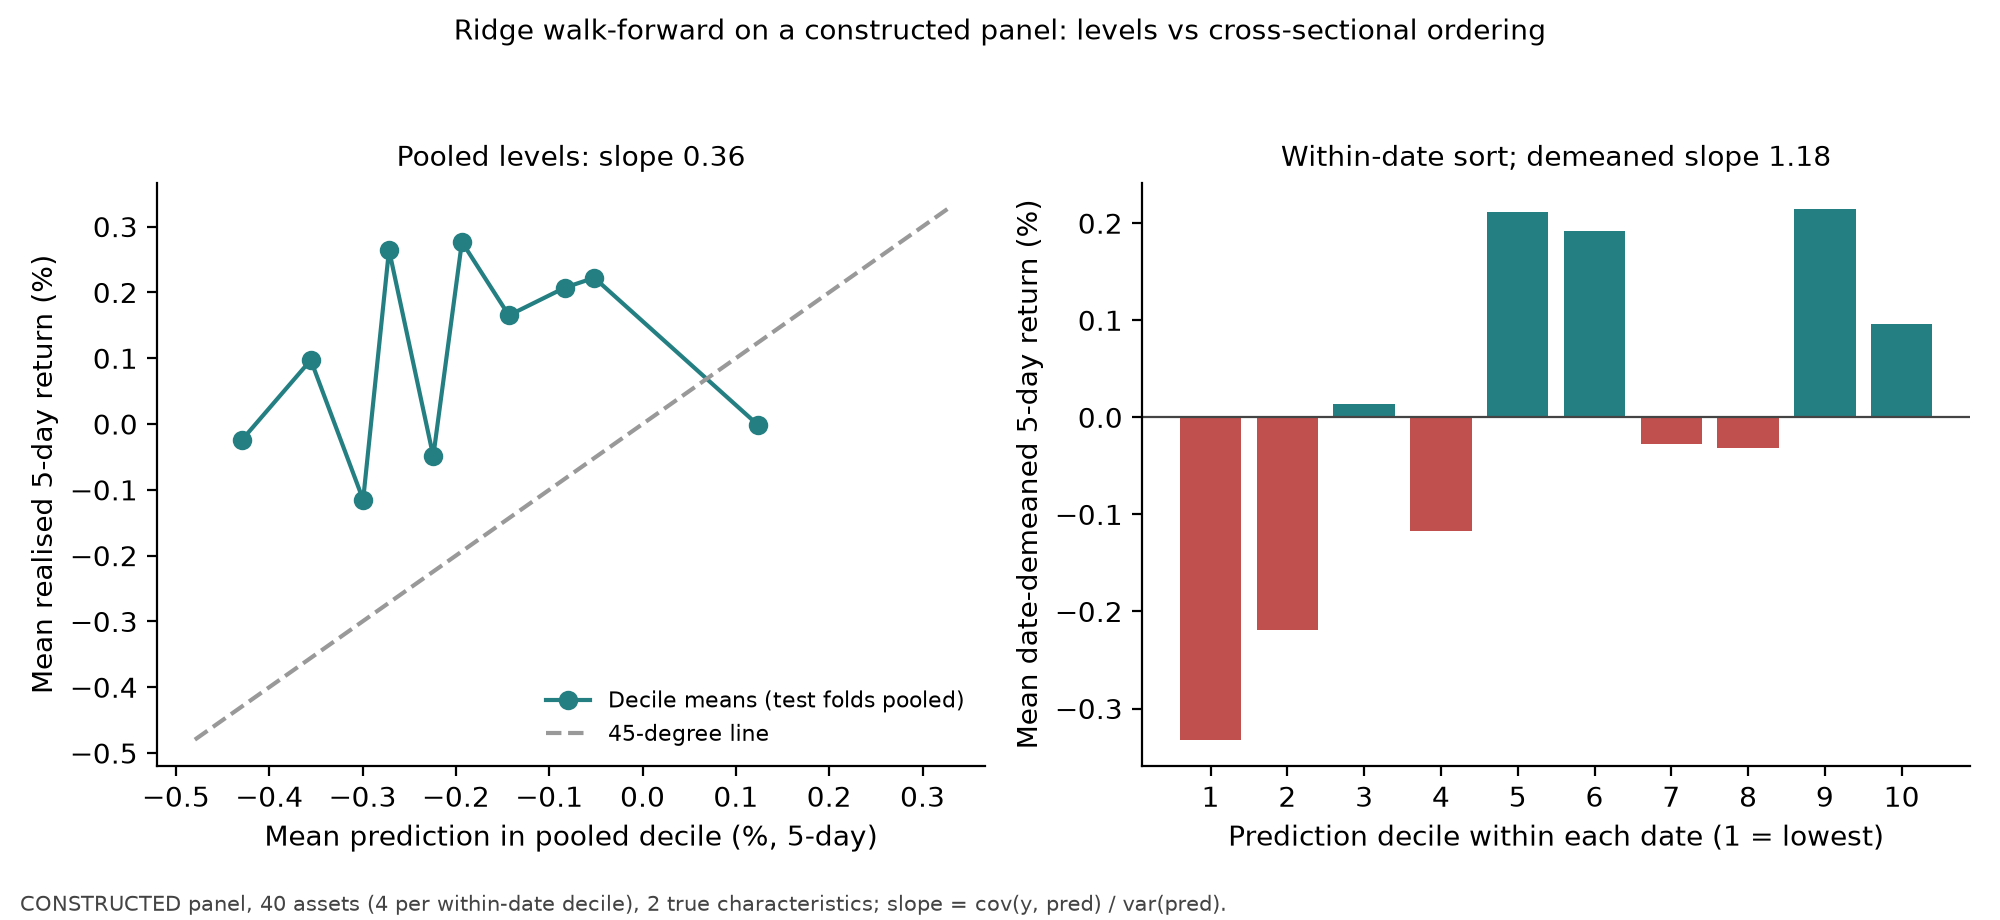
Figure 38-3: Left: horizontal axis is the mean prediction within pooled deciles (%, five-day); vertical axis is the group's mean realized five-day return (%); the dashed line is the 45-degree line. Right: horizontal axis is prediction decile within each date (four assets per group); vertical axis is the group's mean date-demeaned five-day return (%). Observe that the left-panel points are far from the 45-degree line (level forecasts are unreliable); the high-minus-low spread on the right is about 0.43%, but the middle groups are nonmonotonic. Constructed panel, seed 3803.
11. Real-Market Example
This chapter contains no measured real-market results. Project 6's real-data status is blocked: the course does not yet have a licensed daily individual-stock price panel approved for internal training (see the fields and authorization requirements in projects/project06/data_manifest.json). Once data are obtained, applying this chapter's pipeline to real data will require three additional treatments not present in the constructed data:
- Corporate actions: use adjusted returns for labels, but unadjusted prices plus dividend and split events for execution and the ledger (Chapters 29 and 30); do not mix the two.
- Listings, delistings, and the stock universe: freeze the universe membership as of the signal date and include delisting returns in labels (Chapter 30, survivorship bias).
- Asynchronous data: ingest financial features at their announcement times (Chapter 12);
available_atmay be months later than the reporting period.
Report real results separately from the constructed results. The constructed results are not evidence.
12. Common Mistakes
12.1 Using a Row-Count Gap for a Panel
import numpy as np
from sklearn.model_selection import TimeSeriesSplit

n_dates, n_assets, h = 30, 4, 5
rows = np.repeat(np.arange(n_dates), n_assets)            # date id of each panel row
tr, te = list(TimeSeriesSplit(n_splits=3, gap=h).split(rows))[0]
last_d, first_d = rows[tr[-1]], rows[te[0]]
print("train rows on its last date:", int((rows[tr] == last_d).sum()), "of", n_assets)
print("date gap between train and test:", first_d - last_d)   # WRONG: 1 date, contract needs lag+h-1 = 5
Expected output: train rows on its last date: 1 of 4 and date gap between train and test: 1. The reason is that gap counts rows (the local scikit-learn 1.9.1 documentation says it excludes samples from the end of each training set). In this example, the last training row, 24, belongs to date 6; the first test row, 30, belongs to date 7, so the difference in date indices is 1. The maturity condition requires the most recent training signal date to be at least 6 dates before the first test date, that is, to exclude five full signal dates in between (WRONG comment mixes up the difference in date indices and the number of excluded dates; do not read that comparison as the contract. Only one stock from the last training date remains in training, and rows from the same date can also fall on different sides across the gap and test block. Fix: ml_pipeline.date_walk_forward, which groups by date and filters by label_available_at.
12.2 Full-Sample Feature Selection or Imputation
Incorrect: fit SelectKBest(...).fit(X_all, y_all) first, then run walk-forward. The numerical cost is in Section 8.3: pure noise gets IC 0.048. Fix: put selection in a Pipeline and refit it in every training fold.
12.3 Shuffled K-Fold
Incorrect: use KFold(5, shuffle=True) for a panel with overlapping labels. Cost: Section 8.2 (kNN +56.7%). Fix: date walk-forward; use date-block purged K-fold only for an explicitly diagnostic purpose and pair it with embargo (Section 6.2).
12.4 Starting the Label at the Signal Close
import pandas as pd
close = pd.Series([20.0, 20.0, 20.2, 20.4, 20.2, 20.0])
k, lag, h = 2, 1, 2                                         # signal at index 2 (k=3 in 1-based terms)
wrong = close[k + h] / close[k] - 1                          # WRONG: starts at the signal close
right = close[k + lag + h] / close[k + lag] - 1              # starts at the trade close
print(round(wrong, 6), round(right, 6))                      # 0.0 -0.019608
Reason: a signal at the close cannot execute at that same close (Chapter 29, lag>=1). Starting the label at the signal close includes a day's return that cannot be traded. Fix: make_forward_labels(..., execution_lag=1).
12.5 Treating a Five-Day Label as a Daily Holding Return
Incorrect: rebalance daily using five-day labels and treat the average five-day label as the portfolio's daily return. Adjacent five-day labels overlap by four days, while a portfolio rebalanced daily actually holds for one day. Fix: calculate NAV from daily prices at the portfolio layer (Chapter 29 ledger), and state the rebalancing frequency separately from the label interval. Project 6 rebalances every five signal dates and records NAV daily.
12.6 Calibrating or Tuning on the Test Set
Incorrect: estimate the calibration slope during the test period and use it to evaluate that same period. Fix: estimate calibration coefficients only on the inner validation set, just like hyperparameters. The test in tests/test_ml_pipeline.py that changes test labels to absurd values while requiring predictions to stay unchanged guards this rule.
13. Quant Research Application
Write this chapter as the pipeline specification for Project 6 (constructed data validate only the specification itself):
- Data dictionary:
event_time,available_at, units, and missing-data rules for each field;signal_time,trade_time, label interval,label_available_at, and frequency (projects/project06/data_dictionary.md). - Labels:
, , simple return starting at the execution close. - Splitting: expanding-window, date-grouped walk-forward; freeze the first training window and test-block length in advance; the availability rule automatically excludes
dates. - Preprocessing: compute cross-sectional transforms within each date; put all across-date transforms in a
Pipeline. - Tuning: date walk-forward inside the outer training set; freeze the grid in advance and record the selection in each fold.
- Evaluation: at the prediction layer, report
against both baselines, cross-sectional , IC and Newey–West , and calibration slope. At the portfolio layer, apply an explicit rule (cross-sectional demeaning, gross exposure 1, rebalance every five days, execution lag , proportional costs) and report net-of-cost returns, turnover, and drawdown. - Baselines: zero forecast and training mean (constant across the cross-section, so the portfolio is flat).
- Falsification criteria: cross-sectional IC has an insignificant Newey–West
; net-of-cost returns are not positive; or results depend on a single fold.
14. Chapter Summary
A signal date before fit time does not mean the label is known. Filter each panel row by label_available_at fit_time; the number of excluded dates,
15. Exercises
38-E01 (Availability Time)
Using this book's default cutoff available_at for each item and decide whether it can be used for the
38-E02 (Hand-Calculated Labels and Available Rows)
Use the prices in Section 8.1,
38-E03 (Number of Excluded Dates)
For
38-E04 (Embargo)
A study uses date-block purged K-fold and features rev_5 (five-day lookback) and mom_60_5 (60-day lookback), with label horizon
38-E05 (Standardization Invariance and Its Conditions)
(a) Prove that with-intercept OLS training fitted values are invariant to affine standardization; if the training design
38-E06 (The Lookup Mechanism in Shuffled K-Fold)
Features are AR(1) with
38-E07 (Rows in Nested Tuning)
An outer fold is fitted at
38-E08 (Level–Cross-Section Decomposition)
There are two assets on each of two dates: on date 1,
38-T01 (Added: Maturity, Snapshot, and Signal)
Use the exact timeline in Section 4. (a) Historical row A's label is ingested at 15:55 and row B's at 16:20; both rows' features were ingested the previous day. Which row can be used in the 16:09 fit? (b) A same-day feature is ingested at 16:08 and earnings at 16:30; which can be used for the 16:10 signal? (c) If fitting finishes at 16:12, what should happen to the 16:10 signal? (d) Why is checking only the date of label_end insufficient?
16. Programming Exercises
38-P01 (Labels and Timing)
Use make_forward_labels to reproduce the table in Section 8.1. Acceptance criteria: (1) y for the nine signal dates × three assets matches the table (tolerance label_end and missing y; (3) execution_lag=0 and horizon=True raise ValueError; (4) changing any price to 0 or inf raises an error.
38-P02 (Feature Selection Inside a Pipeline)
On simulate_return_panel(n_noise=200, signal_loading=0), compare full-sample selection with selection inside a Pipeline. Acceptance criteria: both use the same date_walk_forward folds; report
38-P03 (Counterexample to a Row-Count Gap)
Construct an unbalanced panel (one or two stocks missing on some dates) and compare the last training date and first test date from TimeSeriesSplit(gap=h*N) and date_walk_forward. Acceptance criteria: find at least one fold where TimeSeriesSplit puts the same date on both sides, or where the last training row's label_end is later than the first test signal date.
17. Challenge Problems
38-C01 (Derive the Embargo for Purged K-Fold)
Let the longest feature lookback be
38-C02 (Calibration and a Trading Threshold)
The cross-sectional calibration slope on the inner validation set is
18. Solutions / Solution Hints
38-E01
With the default cutoff available_at is the actual delivery time and it cannot be used for available_at is the 16:30 release (and ingestion) time, after the cutoff, so it cannot be used for the available_at is the after-hours announcement time, after the cutoff, so it cannot be used for available_at in the data dictionary; do not infer availability from the date alone.
38-E02
(a) B at
38-E03
The availability rule excludes
38-E04
First purge overlapping labels; then, relative to the last test label_end, apply a conservative embargo based on the longest 60-day feature lookback. Under the strict half-open return-increment interval, delete through
38-E05
(a) See Section 6.3: equal column spaces imply equal training fitted values (full rank is not needed); with full column rank, the OLS solution is unique, and the coefficient correspondence implies equal predictions at new points. (b) In the rank-deficient example in Section 6.3, the second column of LinearRegression prediction is 2.20 and the StandardScaler-then-regression prediction is 1.75. The solution set is
import numpy as np
from sklearn.linear_model import Ridge
x = np.array([[1.0], [2.0], [3.0], [4.0]]); y = np.array([1.0, 2.0, 3.0, 5.0])
p1 = Ridge(alpha=1.0).fit(x, y).predict([[5.0]])[0]
p2 = Ridge(alpha=1.0).fit(10 * x, y).predict([[50.0]])[0]
print(round(p1, 4), round(p2, 4))   # 5.4583 5.9935 -> different
38-E06
38-E07
Outer training dates are date_walk_forward on a 700-day single-asset series.
38-E08
Total error: date 1 has
38-P01
Complete reference method: construct the 3 × 12 prices from Section 9, then, for each asset and close.iloc[k+2]/close.iloc[k]-1 (here the Python loop variable iloc[k] is the execution date), and compare it with the label at signal position k-1. Check the final three dates for missing values. The following zero-based assertions are more direct:
for j in range(9):
    for asset in close:
        got = labels.loc[(close.index[j], asset)]
        expected = close[asset].iloc[j+3] / close[asset].iloc[j+1] - 1
        assert abs(got['y'] - expected) < 1e-6
        assert got['label_start'] == close.index[j+1]
        assert got['label_end'] == close.index[j+3]
assert labels.loc[(close.index[9:], slice(None)), 'y'].isna().all()
Then call with execution_lag=0 and horizon=True, and with copies in which a price is changed to 0 or inf; use try/except ValueError to confirm that each invalid input is rejected, and explicitly raise AssertionError if it is not. These are reference methods for readers; this batch did not run the course API. Existing test location: tests/test_ml_pipeline.py::test_01_hand_computed_labels.
38-P02
Reference implementation: code/ch38_ml_pipeline.py::selection_leak. In the book's run, full-sample selection gives Pipeline gives SelectKBest on X_all,y_all, then train fold by fold. In the correct branch, build Pipeline([StandardScaler, SelectKBest, Ridge]) in each fold and call fit with training rows only. Write both branches' predictions back to the original index and calculate metrics on the same valid evaluation set. For the perturbation check, keep the original folds, features, and inner rules fixed and replace only the outer-test labels in that fold:
changed = labels.copy()
changed.iloc[fold.test_rows, changed.columns.get_loc('y')] = 5.0
# fitted transformations and selection use fold.train_rows only
p1 = fit_training_only_pipeline(X, labels, fold).predict(X.iloc[fold.test_rows])
p2 = fit_training_only_pipeline(X, changed, fold).predict(X.iloc[fold.test_rows])
np.testing.assert_array_equal(p1, p2)
Here, fit_training_only_pipeline means the per-fold training-only selection function described above; it reads only X.iloc[fold.train_rows] and the corresponding nonmissing training labels. Test labels must not be used to choose selection_leak and tests/test_ml_pipeline.py::test_host_predictions_do_not_depend_on_test_labels. This batch did not recompute the simulation.
38-P03
Following the correction already applied in I3: use rows=np.repeat(np.arange(30),4)[1:] to remove one row from date 0, leaving 119 rows. In the first fold of TimeSeriesSplit(n_splits=3,gap=20), the final training row is index 11, from original date 3; the first test row is index 32, from original date 8. With gap=20 does not put the same date on both sides; do not invent that as the failure.
rows = np.repeat(np.arange(30), 4)[1:]
tr, te = next(TimeSeriesSplit(n_splits=3, gap=20).split(rows))
assert len(rows) == 119
assert (tr[-1], te[0], rows[tr[-1]], rows[te[0]]) == (11, 32, 3, 8)
assert rows[tr[-1]] + 1 + 5 > rows[te[0]]
For the date-based version, first block by unique dates, then filter rows individually by label_available_at <= fit_time. Check that training and test dates do not overlap, every retained label is mature, and retained training-label intervals do not overlap test-label intervals (overlap within either set is allowed). See the interface in Section 9; do not infer maturity from a row-count gap.
38-C01 (Reference Argument for the Embargo Derivation)
First purge true label overlap. A remaining future training row has finite return-increment feature support
38-C02 (Grading Rubric)
(a)
38-T01 (Complete Answer)
(a) Row A satisfies 15:55 available_at label_end tells when the return interval ended; label_available_at tells when the program could first read the label. Vendor delay separates the two. The daily rule
19. Further Reading
- Must Know: Chapter 31 (label intervals, purging, embargo, walk-forward, and nested selection). This chapter adds panels and availability times to its single-series version.
- Must Know: scikit-learn's Common pitfalls (
SK_PITFALLS), sections on leakage andPipeline; thePipelineandGridSearchCVuser guides (SK_PIPE_DOC,SK_GRID_DOC), including the explanation thatfitacts only on training data. - Should Know: Cawley and Talbot (2010), on overfitting in model selection and selection bias (
CH38_CT2010); read the abstract and Section 5 to understand why tuning and evaluation must be separated. - Should Know: López de Prado (2018), Chapter 7 (purged K-fold and embargo,
CH38_PRADO2018); the author checked only the publisher's table of contents, not the chapter text. - Optional: scikit-learn's probability calibration guide (
SK_CALIBRATION), for reliability diagrams for classification.
20. References
SK_TSS: scikit-learnTimeSeriesSplit. Supports the statement in Section 6.2 thatgapcounts samples (the reconnaissance report read the 1.9.1 docstring; the author checked thegapparameter description in the local 1.9.1 version; seesource_notes).SK_PITFALLS: scikit-learn, Common pitfalls and recommended practices. Supports preprocessing leakage in Section 5 and Section 12.2.SK_PIPE_DOC,SK_GRID_DOC: scikit-learn user guides for Pipeline / composite estimators and hyperparameter search (1.9.1). Support the Pipeline definition in Section 5.SK_CALIBRATION: scikit-learn user guide to probability calibration. Supports the classification version of reliability diagrams in Section 5.CH38_CT2010: Cawley, G. C., Talbot, N. L. C. (2010). “On Over-fitting in Model Selection and Subsequent Selection Bias in Performance Evaluation.” JMLR 11, 2079–2107. Supports separating tuning from evaluation in Section 5.CH38_PRADO2018: López de Prado, M. (2018). Advances in Financial Machine Learning. Wiley. Chapter 7 table of contents. For further reading only.- Chapter 31,
quant_course.validation(intervals_overlap,purged_kfold_splits,embargo), and Chapter 23,quant_course.factor_research(ic_series,ic_summary). Seecourse/zh/chapters/ch38/source_notes.mdfor the reading record.