CHAPTER 28/ 45
Multi-Factor Models: Preprocessing, Combination, and Constraints
Through line: A multi-factor workflow has three distinct responsibilities. Preprocessing changes the scale, outliers, and unwanted exposures of an individual signal, using only the cross-section for the same date. Combination determines how several signals are added, with weights fixed before seeing evaluation-period returns. Constraints determine which exposures the final portfolio may have. Mixing these steps leads to errors that do not raise exceptions but make results unreliable: choosing weights from test-period returns, standardizing with full-sample means, or orthogonalizing in an order chosen after seeing the results. Prerequisites: Chapter 24 (value and point-in-time fundamentals), Chapter 25 (momentum), Chapter 26 (quality), Chapter 27 (carry and low risk), Chapter 23 (cross-sectional research), and Chapter 21 (portfolio construction). After this chapter, you should be able to define same-date z-scores, winsorization, ranks, and normal scores and describe their IC properties; use same-date regressions to
neutralizeindustries and size and explain how this relates to linear projection of weights; derive the composite IC of two correlated signals and explain why orthogonalization order matters; describe two treatments for missing factors and their scale biases; explain why full-sample standardization is unusable; and use published factor returns to show that correlations can change sign over time and to derive the Sharpe-ratio formula after diversification.
1. Chapter goals
Readers should be able to answer: What steps turn a raw signal into a tradable portfolio, and which date's data does each step use? Why can neutralizing a signal recover IC that an industry shift has diluted? Why does the order matter when two correlated factors are combined? What should we do when a company is missing one factor? Can weights be chosen from performance in the evaluation period?
- Distinguish the responsibilities of the three layers: preprocessing (one signal, same-date cross-section), combination (multiple signals, weights fixed in advance), and constraints (portfolio-level exposure limits); explain what data each layer may use.
- Define and implement same-date winsorization, z-scores, robust z-scores, ranks, and normal scores; state which transformations preserve Spearman IC and which change Pearson IC.
- Derive the attenuation factor
in Pearson IC when a signal contains a component unrelated to returns (an industry shift, size loading, or outlier), and verify it on a constructed panel using 60 new seeds. - Derive the algebra of same-date regression neutralization: with all industry indicators, the residual is the within-group demeaned value; with a size control, the procedure is two-step Frisch–Waugh–Lovell; residuals are orthogonal to controls; residuals do not change in a redundant design (industry indicators plus an intercept); for weights proportional to the signal, linear-constraint projection and neutralization produce the same vector, but not for quantile weights.
- Derive the composite IC of two standardized signals,
, and the IC after sequential orthogonalization; explain order dependence; derive the IC-maximizing weights proportional to and state the requirements. - Explain how “zero fill” and “reweight over available factors” change scale, using the variance formula
, and report coverage. - Explain the look-ahead problem in full-sample standardization, give an expanding version that uses only the past, and show a numerical counterexample.
- Read published FF5 factor returns: the correlation matrix, the opposite signs of HML–RMW correlations in 1963–1999 and 2000–2026, and the range of rolling correlations; derive and check the Sharpe ratio for an equal-risk average.
- Report returns, risk, and exposures for three portfolio constructions (quantile weights on neutralized signals, quantile weights on the raw composite, and the raw composite projected to industry neutrality), and state that these are results from a constructed panel.
Completion criterion: Every multi-factor signal includes a process table stating the order of each step, which date it uses, when and by whom each parameter was fixed (winsorization quantiles, z-score degrees of freedom, minimum factor count, weights), and the share of names dropped or imputed.
2. Why the multi-factor workflow needs clear boundaries
Chapters 24–27 each construct a factor: value, momentum, quality, and carry/low risk. Their units differ (ratios, returns, accounting ratios, beta); their cross-sectional distributions differ (some are heavy-tailed); they contain components unrelated to returns (industry shifts, size); they are correlated; and they cover different sets of names. Compressing them into one sortable score requires a series of researcher choices. Each choice can be judged by evaluation-period returns, so each choice is a degree of freedom. Chapter 22 explains how to count these degrees of freedom; this chapter explains their mathematical objects and which dates each step may use.
This chapter has three rules. First, preprocessing uses only the same-date cross-section: the output for row
The sequence is: define same-date transforms (6.1), derive attenuation from noise (6.2) and the algebra of neutralization (6.3); then derive composite IC and order dependence (6.4), weight choice (6.5), and missing-factor treatments (6.6); next address look-ahead in time-series standardization (6.7), factor correlation and diversification (6.8), and the definition of crowding (6.9); finally report results on a constructed panel (Section 10) and published factor returns (Section 11).
3. Intuition
Imagine three analysts scoring 300 stocks each. The first analyst's scores include an industry-wide optimistic shift (every technology stock gets 2 extra points). The second occasionally assigns one or two stocks outlier scores of
Combination is a separate task: how should the three analysts' scores be added? If two analysts' scores are highly correlated, they are saying much the same thing, so adding them provides little new information. If we let the first analyst speak, then listen to only the part of the second analyst that the first did not capture (orthogonalization), the order changes what remains from the second. If we assign more weight to whoever performed better in the past, and “the past” is the evaluation period, we are choosing weights from the answer.
Constraints come last: must the final long-short portfolio have zero net position in each industry? Should market or size exposure be limited? Signal neutralization can approximate this step, or weights can be projected directly. In the linear case these are the same operation.
Simplifying boundary: In this chapter's constructed panel, industry shifts, size loadings, and outliers are disturbances specified by the author, so neutralization and winsorization help. In real data, an industry shift may itself predict returns; in that case neutralization would remove true signal and the conclusion would reverse. This chapter does not simulate that case.
3.1 From one row of data to positions: each step produces a different object
Why do we need this chapter after defining fields in Chapters 24–26? Ratios, returns, and accounting quantities cannot be added directly; peer residuals, scale, coverage, and weights must be settled one layer at a time. Report the missing-name list, factor correlations, and position intersection together, but position similarity alone does not establish real crowding (Section 6.9).
4. Mathematical foundations
Notation. Date signal_time is month-end; the evaluation label is for the following month.
Same-date z-score. ddof=1) over
Same-date winsorization. Take the day's quantiles
Ranks and normal scores. Use average rank
Neutralization. For each date
Orthogonalization. Regress signal
Combination. For standardized signals
Composite IC. Let the standardized signals have variance 1 and correlation matrix
Diversification of factor returns. For
5. Formal definitions
Same-date cross-sectional transform. The output for date
Time-series standardization. Standardize a signal's time series using its mean and standard deviation. A full-sample fit estimates the mean and standard deviation using all dates, including future dates; an expanding version uses only rows
Winsorization. Move values outside a quantile interval to the nearest endpoint. This changes magnitude but preserves the ordering among names that were not winsorized.
Z-score and MAD-based robust z-score. The first uses the mean and standard deviation; the second uses the median and
Normal scores. Use ranks to map any distribution to standard-normal quantiles. This discards raw magnitudes and is more robust to extreme magnitudes that do not change ranks within a fixed set of paired observations. Adding an outlier name, changing missingness, or introducing ties can still change the mapping; normal scores do not make Pearson IC immune to change.
Neutralization. Regress on controls such as industry indicators and size within the same date, then take residuals. Industry-neutral means that residuals sum to zero within every industry.
Orthogonalization. Regress on an existing signal and take residuals. Sequentially orthogonalizing multiple signals is a Gram–Schmidt procedure; the order determines what each signal retains.
Combining signals and choosing weights. Options include equal weights, fixed economic weights, weights proportional to discovery-period IC, and the IC-maximizing
Missing factor. A name has a missing value for one factor. Treatments include zero fill (zero is the z-score mean), reweight over available factors (divide weights by the sum of absolute available-factor weights), drop (require all factors), and a minimum factor count (return NaN below the required count).
Factor correlation. Distinguish signal correlation (correlation between two signals in the same-date cross-section) from return correlation (time-series correlation between two factor-portfolio returns). The former affects composite IC; the latter affects diversification.
Crowding. The operational definition in this chapter is a situation where many investors hold similar positions, so returns fall together when a factor is forced to deleverage. It can be described using position overlap (the intersection share of same-date top-quintile sets) and return correlation during stress periods. This chapter reports only constructed overlap values and has no actual holdings data, so it does not draw conclusions about real crowding.
Constraints. Linear restrictions on portfolio weights, project_to_constraints finds the feasible weights closest in Euclidean distance.
6. Derivations
6.1 How same-date transforms affect IC
For a daily cross-section of signal groups. Pearson IC generally changes. Normal scores reduce the influence of extreme magnitudes, but adding names, changing the valid set, or changing ranks can still change results. Winsorization creates ties, so it may also change Spearman IC; it is not always “nearly unchanged.” Pearson IC may change substantially as well.
6.2 Attenuation of IC by a disturbance
Suppose the observed signal in a daily cross-section is
When disturbance variance equals true-signal variance, IC falls to
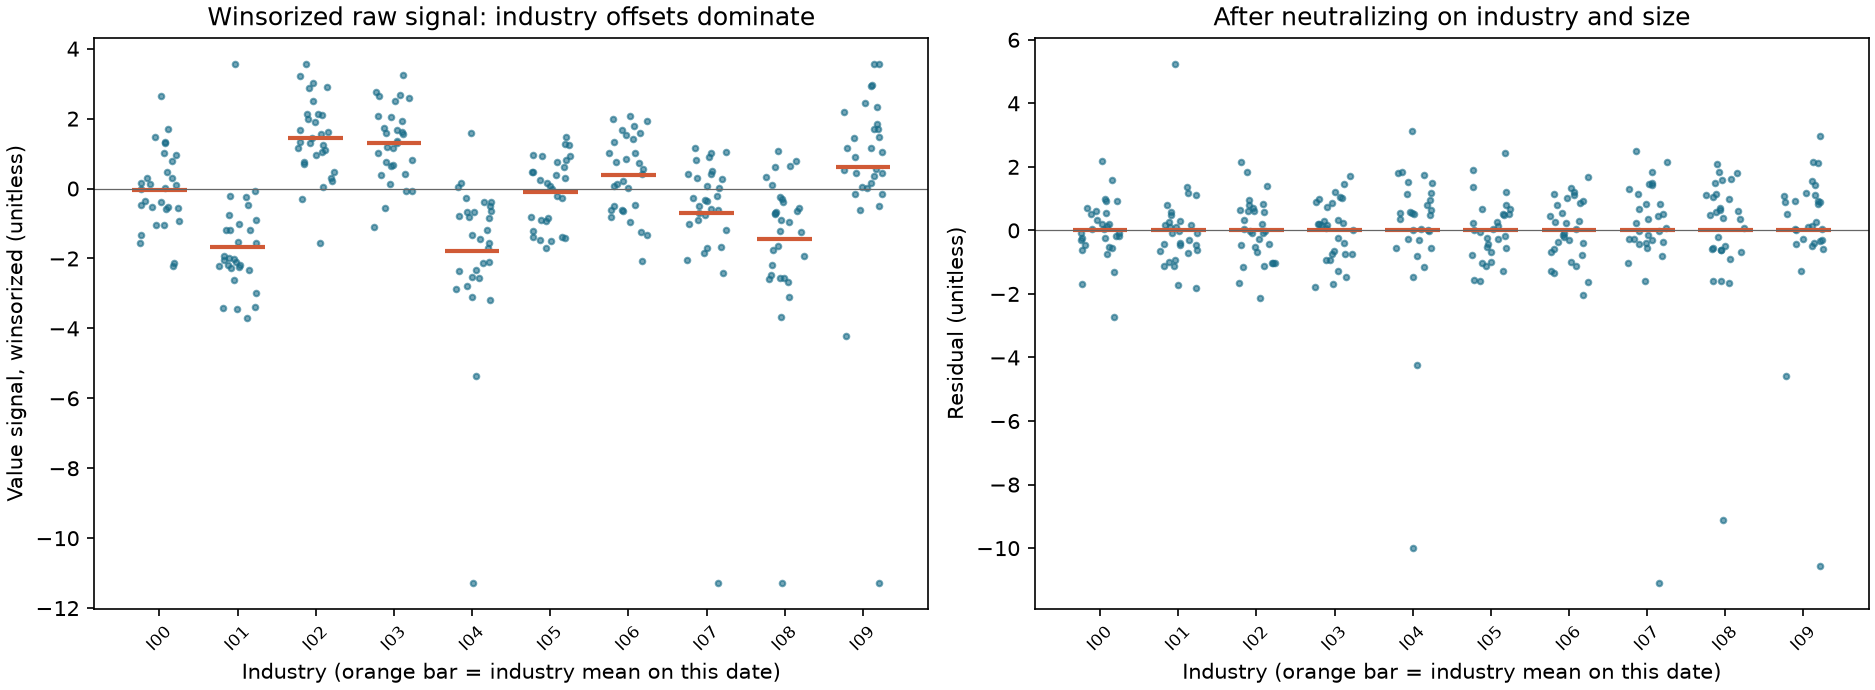
Winsorization removes most of the outlier variance; neutralization removes industry shifts and size loadings. This is the arithmetic behind “each step recovers some of the true IC.”
The assumptions matter: the disturbance must be unrelated to the label. If an industry shift itself predicts returns, it is not noise, and neutralization will remove it. Whether to neutralize is a research hypothesis and must be written into the plan.
6.3 Algebra of neutralization
All industry indicators. Let
With a size control. Let
The displayed division requires
Thus
Invariance under a redundant design. Adding a constant column (the sum of all industry indicators) makes the design matrix rank deficient. The residual is the projection of lstsq's minimum-norm choice. (In the test, residuals with and without a constant control column differ by less than
An industry with one stock. Its indicator uses a degree of freedom by itself, so its residual is always zero. If a date has too few valid names (fewer than 2 residual degrees of freedom), the row is NaN, not zero.
Relation to linear projection of weights. Let weights be project_to_constraints computes neutralize the signal, then take positions proportional to it” and “take positions proportional to the signal, then project” produce the same vector. Quantile weights (top quintile project_to_constraints requires linearly independent rows).
6.4 Composite IC and orthogonalization order
Assume
Sequential orthogonalization. Keep
Reversing the order gives
sequential_orthogonal_ic).
IC-maximizing weights. Maximize
Interpretation. There is no “correct” order. Choosing the order with the highest evaluation-period IC is multiple testing (Chapter 22). A defensible approach is to state in advance that the economically most basic factor comes first and to record all order variants in the ledger.
6.5 Weight choice and tuning optimism
Equal weights require no estimation. Weights proportional to discovery-period IC,
6.6 Missing factors: whose scale changed?
Suppose there are
Reweight over available factors:
For the constructed panel's three factors,
Missingness mechanism. Under missing completely at random (MCAR), the scale comparison above applies to the corresponding subset moments. If missingness depends on the signal (for example, loss-making companies lack a profitability ratio), conditional moments may also change; bias is not necessarily mild or larger. This chapter simulates only random missingness. Recommended practice: set a minimum number of factors (such as 2), report coverage, run sensitivity checks for both treatments, and record variants in the ledger.
6.7 Look-ahead in time-series standardization
Standardizing each stock's signal time series using the full-sample mean and standard deviation makes row expanding_zscore has this test). Same-date cross-sectional transforms use only the current row, but point-in-time eligibility also requires that the input version and policy for that row were known at the time.
6.8 Factor correlation, diversification, and unstable correlations
For an equal-risk average of
When diversified_sharpe requires a value strictly above the bound). Examples for
If the factors have equal risk but different Sharpe ratios, replace
Correlation is estimated. Under an i.i.d. approximately bivariate-normal model and a large-sample approximation, the standard error of the sample correlation from
6.9 Crowding: definition and what can be measured
Measuring crowding requires knowing how much capital holds similar positions, which calls for holdings, short-borrow rates, fund flows, and similar data. This chapter has none of those, so it can do only two things: (i) measure signal-level position overlap as the intersection share of two factors' same-date top-quintile names; under independence this should be 0.20; and (ii) measure return-level synchronicity using factor-return correlations and rolling correlations. The first is calculated in the constructed panel (value/momentum 0.10, value/quality 0.10, momentum/quality 0.28); the second uses published factor returns (Section 11). Neither establishes “crowding”; each is only one observable aspect of it.
6.10 Projection on the support set: who is neutral, and when?
The support set
Let
Projecting the full-column weights first and then zeroing unlisted names generally differs from this formula: masking deletes coordinates that used to offset industry net positions. If an industry has only one listed name, its constraint sets that name's weight to zero; this is not rank deficiency of the full matrix, but the absence of any nonzero hedge direction in that industry. An empty support set, no initial long-short portfolio, or a numerically zero projection must explicitly result in cash. Missing classifications or misaligned axes must fail explicitly; do not silently replace invalid inputs with zero.
Gross exposure and homogeneous constraints. If
Two thresholds. P4's min_names_per_date=60 counts
Clock and residuals. At month-end
7. Financial interpretation
Preprocessing removes components unrelated to returns; it is not signal beautification. At each step, ask whether the removed component is really noise. Industry shifts, size loadings, and outliers are noise in the constructed panel, so each step recovers some IC (single-world momentum Pearson IC: 0.027 raw, 0.038 after winsorization, 0.048 after neutralization, versus true value 0.053). If a “disturbance” actually carries return information (real industry momentum or a size effect), preprocessing removes it.
Combination gains come from diversification, not magic. The benefit of adding two correlated factors is limited by their correlation; the composite-IC formula shows why. If all of one factor's predictive power comes from its correlation with another, it adds no incremental information.
Order and weights are researcher degrees of freedom. Orthogonalization order, weight choice, missing-factor treatment, and winsorization quantiles can all look “better” or “worse” in the evaluation period. Fix these choices in advance, record all variants, and evaluate tuning on an independent holdout.
Neutralization and constraints. For linear weights, signal neutralization and weight projection agree; for quantile weights, they differ. Therefore, “industry neutral” must say which operation was used: neutralize the signal and then rank, or rank and then project the weights. The two have different exposures, volatility, and turnover (Section 10).
Correlation is unstable. The correlation between published value and quality factors has opposite signs in different 20–30-year periods. Choosing weights from an estimated correlation matrix therefore relies on an estimate that can change sign. The diversification arithmetic (the
8. Numerical examples: work through each step
All values are produced by hand_examples() and independently checked by qa/a5/claude/recompute/ch28_recompute.py. The stocks and signals are teaching constructions.
8.1 Winsorization, z-scores, and normal scores
On one date, 11 stocks have signals
- Z-scores without winsorization: mean
, standard deviation . The outlier's ; the other ten are compressed between (signal 1) and (signal 10), making them hard to distinguish. - Winsorization (10th and 90th percentiles, linear interpolation):
and 9, which are the 2nd and 10th order statistics, so and . Values become , with mean . The sum of squared deviations is ; sample variance is and standard deviation is . Signals 10 and 100 both have ; signal 5 has , slightly below its un-winsorized value of , but the ten ordinary names now span to . - Normal scores:
. Signal 100 (rank 11) gets ; signal 10 (rank 10) gets . Magnitudes are discarded; only ranks remain.
8.2 Industry neutralization: reversing the sign
There are six stocks: industry A is
- Raw Pearson IC:
, , , , and . Thus IC . - After neutralization: industry means are 0 and 10, so residuals are
and sum to zero within each industry. , , so IC .
The industry shift is unrelated to the within-industry ordering but points opposite to the industry return. Before neutralization, IC is
8.3 Linear-constraint projection and neutralization produce the same vector
Use
8.4 Two correlated signals: equal weights, two orthogonalization orders, and the optimum
8.5 Missing factors
Two factors have weights
- Reweight over available factors:
(preserves the z-score scale). - Zero fill:
(shrunk toward 0).
Section 6.6 gives the broader example: for three factors with average correlation
8.6 Look-ahead in standardization
A stock's signal sequence is
8.7 Diversification
Three factors each have Sharpe ratio 0.3. Average correlation 0 gives
8.8 Three-coordinate support set in a four-name universe: counterexample to project-then-mask
There are four names a, b, c, d; industry A is a, b, and industry B is c, d. The weights
The correct support set is
Subtracting the industry means gives
Now consider a missing-alpha hedge coordinate. All four names are listed, but only a and c have scores, with initial long-short weights
For contrast, use a nonzero target: industry A has one coordinate and requires
9. Python implementation
Functions are in the new module factor_preprocessing.py; ranking, IC, and quantile weights reuse Chapter 23's factor_research.py; linear-constraint projection reuses Chapter 21's project_to_constraints.
| Function | Input | Output and limits |
|---|---|---|
winsorize_cross_section |
Signal panel, lower and upper quantiles, minimum name count | Winsorize each row to its quantile interval; if valid names are below the minimum, return an all-NaN row; quantiles must satisfy |
zscore_cross_section |
Panel, variance divisor adjustment (ddof=0 or 1), minimum name count |
Compute |
mad_zscore_cross_section |
Panel | Compute |
normal_scores |
Panel | Compute |
neutralize |
Signal, industries (static or date-indexed table), control dictionary | Same-date OLS residuals; a name missing any input is NaN; use the valid pair set for the signal/all controls/group; a date with |
orthogonalize |
Signal, list of panels to regress on | Same-date residual after regression on an intercept and those panels |
combine_signals |
Signal dictionary, weight dictionary, minimum factor count, missing='reweight' or 'zero' | Composite panel and count of available factors with nonzero weight per name (min_factors counts only these); weights must be finite real numbers and not all zero |
expanding_zscore |
Panel, minimum periods | Each row uses mean and standard deviation from rows |
composite_ic |
Correlation vector with label, correlation matrix, weights | Compute |
optimal_composite_weights |
Same inputs | Return |
sequential_orthogonal_ic |
Same inputs plus order | IC of the equal-weight composite after sequential orthogonalization |
diversified_sharpe, average_pairwise_correlation |
Sharpe ratio, factor count, average correlation; or correlation matrix | Compute |
The default offline reading entry point is the accepted reader package's notebooks/ch28_multifactor.ipynb: RUN_FRENCH=False; it constructs 300 names by 120 months (seed 20261121), and the default tuning sweep uses 60 worlds. Create a new RUN_DIR only; do not write historical plots/CSV/JSON. The French analysis and four figures in this chapter are existing historical evidence and are not rerun by the default path. The runner also saves an execution copy and state. Code blocks are retained in full for study; the following are historical CLI/test entry points from the original project, not reader defaults. Do not run them when the isolated package does not include these project entry points:
.venv/bin/python code/ch28_multifactor.py
.venv/bin/python -m pytest tests/test_ch28_preprocessing.py tests/test_ch28_workflow.py -q
Frequency: monthly; signal_time is month-end; each row expanding_zscore for row
Code block one: winsorization, z-scores, and normal scores (Section 8.1).
import numpy as np
import pandas as pd

from quant_course.factor_preprocessing import normal_scores, winsorize_cross_section, zscore_cross_section

x = pd.DataFrame([[1.0, 2, 3, 4, 5, 6, 7, 8, 9, 10, 100]], index=pd.period_range("2026-06", periods=1, freq="M"))
w = winsorize_cross_section(x, lower=0.1, upper=0.9, min_names=10)
assert w.iloc[0].tolist() == [2, 2, 3, 4, 5, 6, 7, 8, 9, 10, 10]
assert abs(w.iloc[0].mean() - 6.0) < 1e-12 and abs(w.iloc[0].std(ddof=1) - np.sqrt(9.2)) < 1e-12
z_raw, z_win = zscore_cross_section(x), zscore_cross_section(w)
assert abs(z_raw.iloc[0, 10] - 3.0) < 0.001 and z_raw.iloc[0, :10].between(-0.46, -0.14).all()   # the ten ordinary names are squeezed together
assert abs(z_win.iloc[0, 9] - 4 / np.sqrt(9.2)) < 1e-12 and abs(z_win.iloc[0, 9] - z_win.iloc[0, 10]) < 1e-12
ns = normal_scores(x)
assert abs(ns.iloc[0, 10] - 1.6906) < 1e-4 and abs(ns.iloc[0, 9] - 1.0968) < 1e-4
Code block two: industry neutralization and linear-constraint projection (Sections 8.2 and 8.3).
import numpy as np
import pandas as pd

from quant_course.factor_preprocessing import neutralize
from quant_course.portfolio_construction import project_to_constraints

cols = list("abcdef")
sig = pd.DataFrame([[1.0, -1.0, 0.0, 11.0, 10.0, 9.0]], index=pd.period_range("2026-06", periods=1, freq="M"), columns=cols)
ret = np.array([0.05, 0.03, 0.04, -0.03, -0.04, -0.05])
groups = pd.Series(list("AAABBB"), index=cols)
res = neutralize(sig, groups=groups)
assert np.allclose(res.iloc[0], [1, -1, 0, 1, 0, -1], atol=1e-12)
assert abs(np.corrcoef(sig.iloc[0], ret)[0, 1] + 0.93475) < 1e-5 and abs(np.corrcoef(res.iloc[0], ret)[0, 1] - 0.2) < 1e-12
A = np.array([[1, 1, 1, 0, 0, 0], [0, 0, 0, 1, 1, 1]], dtype=float)         # industry indicator rows; their sum is the dollar row
proj = project_to_constraints(sig.iloc[0].to_numpy(), A)
assert np.allclose(proj, res.iloc[0], atol=1e-12) and abs(proj.sum()) < 1e-12 and np.allclose(A @ proj, 0)
Code block three: combining two correlated signals and order dependence (Section 8.4).
import numpy as np

from quant_course.factor_preprocessing import composite_ic, optimal_composite_weights, sequential_orthogonal_ic

R = np.array([[1.0, 0.5], [0.5, 1.0]])
rho = [0.04, 0.02]
assert abs(composite_ic(rho, R) - 0.06 / np.sqrt(3)) < 1e-12
a, b = sequential_orthogonal_ic(rho, R, [0, 1]), sequential_orthogonal_ic(rho, R, [1, 0])
assert abs(a - 0.04 / np.sqrt(2)) < 1e-12 and abs(b - (0.02 + 0.03 / np.sqrt(0.75)) / np.sqrt(2)) < 1e-12 and b > a
w, best = optimal_composite_weights(rho, R)
assert np.allclose(w, [1.0, 0.0]) and abs(best - 0.04) < 1e-12 and abs(composite_ic(rho, R, w) - 0.04) < 1e-12
assert best > b > composite_ic(rho, R) > a                                      # 0.0400 > 0.0386 > 0.0346 > 0.0283
Code block four: missing-factor scale (Sections 8.5 and 6.6).
import numpy as np
import pandas as pd

from quant_course.factor_preprocessing import combine_signals

idx = pd.period_range("2026-06", periods=1, freq="M")
z = {"f1": pd.DataFrame([[2.0, np.nan]], index=idx, columns=["s1", "s2"]), "f2": pd.DataFrame([[2.0, 1.0]], index=idx, columns=["s1", "s2"])}
rw, count = combine_signals(z, {"f1": 0.5, "f2": 0.5}, missing="reweight")
zero, _ = combine_signals(z, {"f1": 0.5, "f2": 0.5}, missing="zero")
assert rw.iloc[0].tolist() == [2.0, 1.0] and zero.iloc[0].tolist() == [2.0, 0.5] and count.iloc[0].tolist() == [2, 1]

rng = np.random.default_rng(0)
R = np.array([[1.0, -0.3, -0.3], [-0.3, 1.0, 0.2], [-0.3, 0.2, 1.0]])
full = rng.multivariate_normal(np.zeros(3), R, size=300_000)                      # three standardized factors, mean correlation -0.133
var3 = full.mean(axis=1).var()
assert abs(var3 - (1 + 2 * (-0.1333)) / 3) < 0.005                                # (1 + (k-1) r) / k with k = 3
reweighted_one, zero_filled_one = full[:, 0], full[:, 0] / 3                      # a name that has only the first factor
assert abs(reweighted_one.var() / var3 - 1 / 0.2444) < 0.15 and abs(zero_filled_one.var() / var3 - (1 / 9) / 0.2444) < 0.02
Code block five: look-ahead in standardization (Section 8.6).
import pandas as pd

from quant_course.factor_preprocessing import expanding_zscore

x = pd.DataFrame({"x": [1.0, 2.0, 3.0, 10.0]}, index=pd.period_range("2026-01", periods=4, freq="M"))
past = expanding_zscore(x, min_periods=3)
full = (x["x"] - x["x"].mean()) / x["x"].std(ddof=1)
assert abs(past["x"].iloc[2] - 1.0) < 1e-12 and abs(full.iloc[2] + 0.244949) < 1e-6   # opposite signs at the third observation
changed = x.copy(); changed.iloc[3, 0] = -100.0                                        # change only the last row
assert expanding_zscore(changed, min_periods=3)["x"].iloc[:3].equals(past["x"].iloc[:3])
Code block six: diversification (Section 8.7).
import numpy as np

from quant_course.factor_preprocessing import average_pairwise_correlation, diversified_sharpe

assert abs(diversified_sharpe(0.3, 3, 0.0) - 0.3 * np.sqrt(3)) < 1e-12
assert abs(diversified_sharpe(0.3, 3, 0.2) - 0.43916) < 1e-5 and abs(diversified_sharpe(0.3, 3, 0.8) - 0.32225) < 1e-5
assert abs(average_pairwise_correlation(np.array([[1, 0.2, 0.4], [0.2, 1, 0.0], [0.4, 0.0, 1]])) - 0.2) < 1e-12
assert abs(diversified_sharpe(0.3, 3, 1.0) - 0.3) < 1e-12                          # perfectly correlated: no diversification
10. Reading the figures
Constructed panel. 300 stocks, 120 months (119 months with labels), seed 20261121. Three true signals (value, momentum, quality), with same-date correlations
Figure 28-1: Winsorization and stepwise recovery of IC. Left: histogram (log vertical axis) of one day's value signal; orange is raw (with outliers at
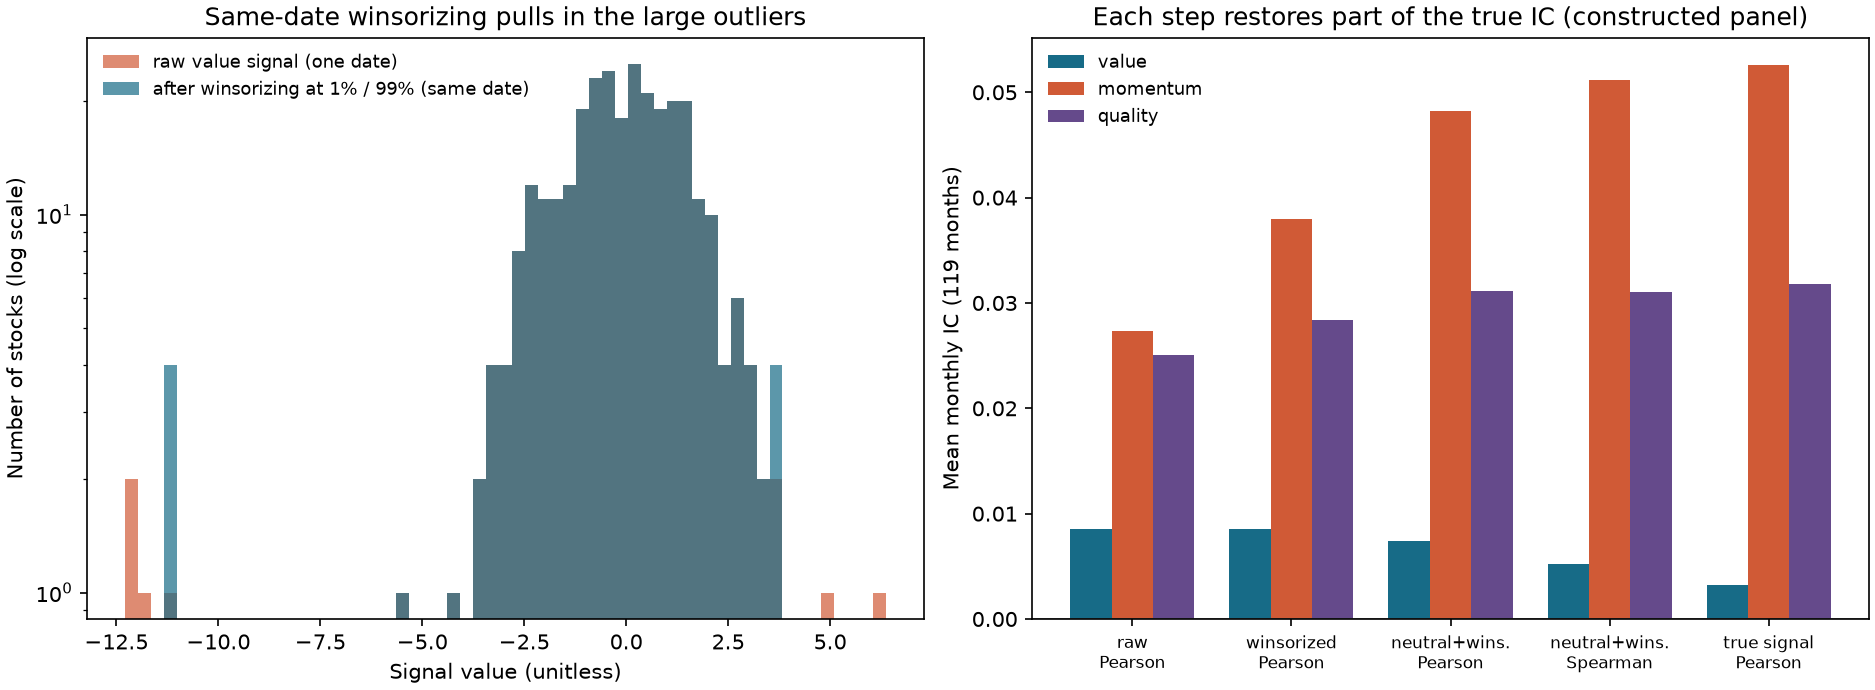
Mean Pearson IC and attenuation across 60 new worlds (raw, after winsorization, and after neutralization plus winsorization, relative to the true signal).
| Factor | True-signal IC | Raw / true | Winsorized / true | Neutralized and winsorized / true | Raw / true predicted in 6.2 |
|---|---|---|---|---|---|
| Value | 0.0159 | 0.553 | 0.629 | 0.878 | 0.540 |
| Momentum | 0.0496 | 0.592 | 0.692 | 0.881 | 0.561 |
| Quality | 0.0327 | 0.576 | 0.676 | 0.859 | 0.553 |
Figure 28-2: Cross-section before and after neutralization. Left: one day's winsorized value signal plotted by industry. Right: residuals after neutralizing industry and size. Orange horizontal lines show the same-day industry means. On the left, industry means are visibly separated (industry shifts explain much of the signal variation); on the right, each industry's mean is zero (the largest absolute industry mean on one date is
Combination (Pearson IC, 119 months; values in parentheses are analytic values using the true signals and true correlation matrix).
| Combination | Measured Pearson IC | Measured Spearman IC | Analytic IC |
|---|---|---|---|
| Equal weight | 0.0562 | 0.0519 | 0.0651 |
| True-loading weights (“oracle” after the fact) | 0.0582 | 0.0548 | 0.0665 |
Sequentially orthogonalize value → momentum → quality |
0.0500 | 0.0467 | 0.0595 |
Sequentially orthogonalize quality → momentum → value |
0.0577 | 0.0532 | 0.0661 |
Sequentially orthogonalize momentum → value → quality |
0.0553 | 0.0511 | 0.0649 |
Sequentially orthogonalize momentum → quality → value |
0.0563 | 0.0518 | 0.0639 |
The best analytic single-factor IC is 0.0493. Order changes IC from 0.0595 to 0.0661 analytically, with measured IC moving in the same direction. Measured Pearson IC is 0.008–0.010 below the analytic value. About 0.006 is sampling variation in this world: an equal-weight combination of the true signals has measured Pearson IC 0.0590 (
Figure 28-3: Combination and tuning. Left: mean Pearson IC for combinations of the same three processed signals (horizontal bars show
The red line is the oracle optimum under the stipulated population DGP moments, not a hard upper bound on every finite-sample measured IC. Likewise, Figure28-1’s “stepwise recovery” describes the specified disturbance mechanism and reported averages; it does not guarantee a monotone increase for value at every step in a single world.
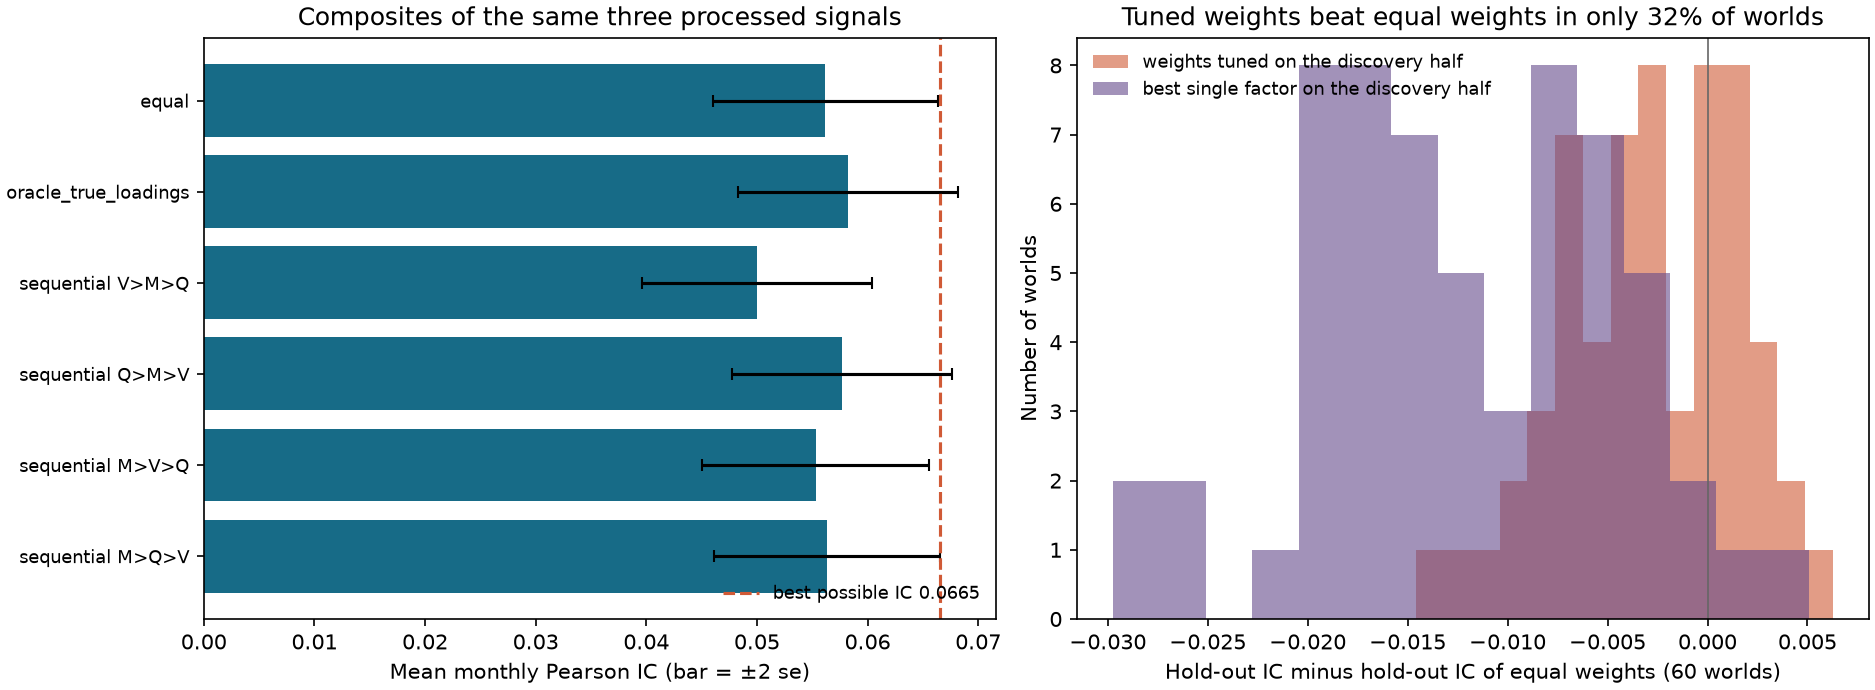
Mean discovery- and holdout-period Spearman IC across 60 new worlds.
| Weight rule | Discovery period | Holdout period | Discovery minus holdout |
|---|---|---|---|
| Equal weight | 0.0578 | 0.0565 | 0.0013 |
| Proportional to discovery-period IC | 0.0569 | 0.0537 | 0.0032 |
| Best discovery-period single factor | 0.0459 | 0.0445 | 0.0014 |
Missing factors (15% random missingness for each processed factor; one world, 119 months).
| Treatment | Mean Spearman IC | Coverage | Share of top quintile from single-factor names |
|---|---|---|---|
| Zero fill (minimum 1 factor) | 0.0467 | 99.6% | 3.5% (these are 5.7% of valid names) |
| Reweight over available factors (minimum 2) | 0.0468 | 94.0% | — |
| Reweight over available factors (minimum 1) | 0.0458 | 99.6% | 8.8% (these are 5.7% of valid names) |
| Drop (require all three factors) | 0.0511 | 61.3% | — |
Interpretation: IC differences are small under random missingness, and the dropped-name treatment uses a different name set, so the numbers are not directly comparable. Scale bias is visible in top-quintile membership: reweighting makes single-factor names appear 1.55 times as often (8.8% versus 5.7%); zero fill reduces their representation to 0.62 times as often.
Constraints (one world, 119 months, gross returns before costs).
| Portfolio | Mean monthly return (%) | Monthly standard deviation (%) | Mean maximum absolute industry net position | Mean absolute size exposure | |
|---|---|---|---|---|---|
| Neutralized signals, quintile weights | 1.188 | 9.29 | 1.395 | 0.053 | 0.084 |
| Raw composite (winsorized and z-scored, not neutralized), quintile weights | 0.992 | 6.15 | 1.758 | 0.361 | 0.258 |
| Same as above, with weights projected to industry neutrality | 0.870 | 10.19 | 0.931 | 0.230 |
The projected portfolio has exactly zero industry net and the lowest volatility (0.93%), so it has the highest
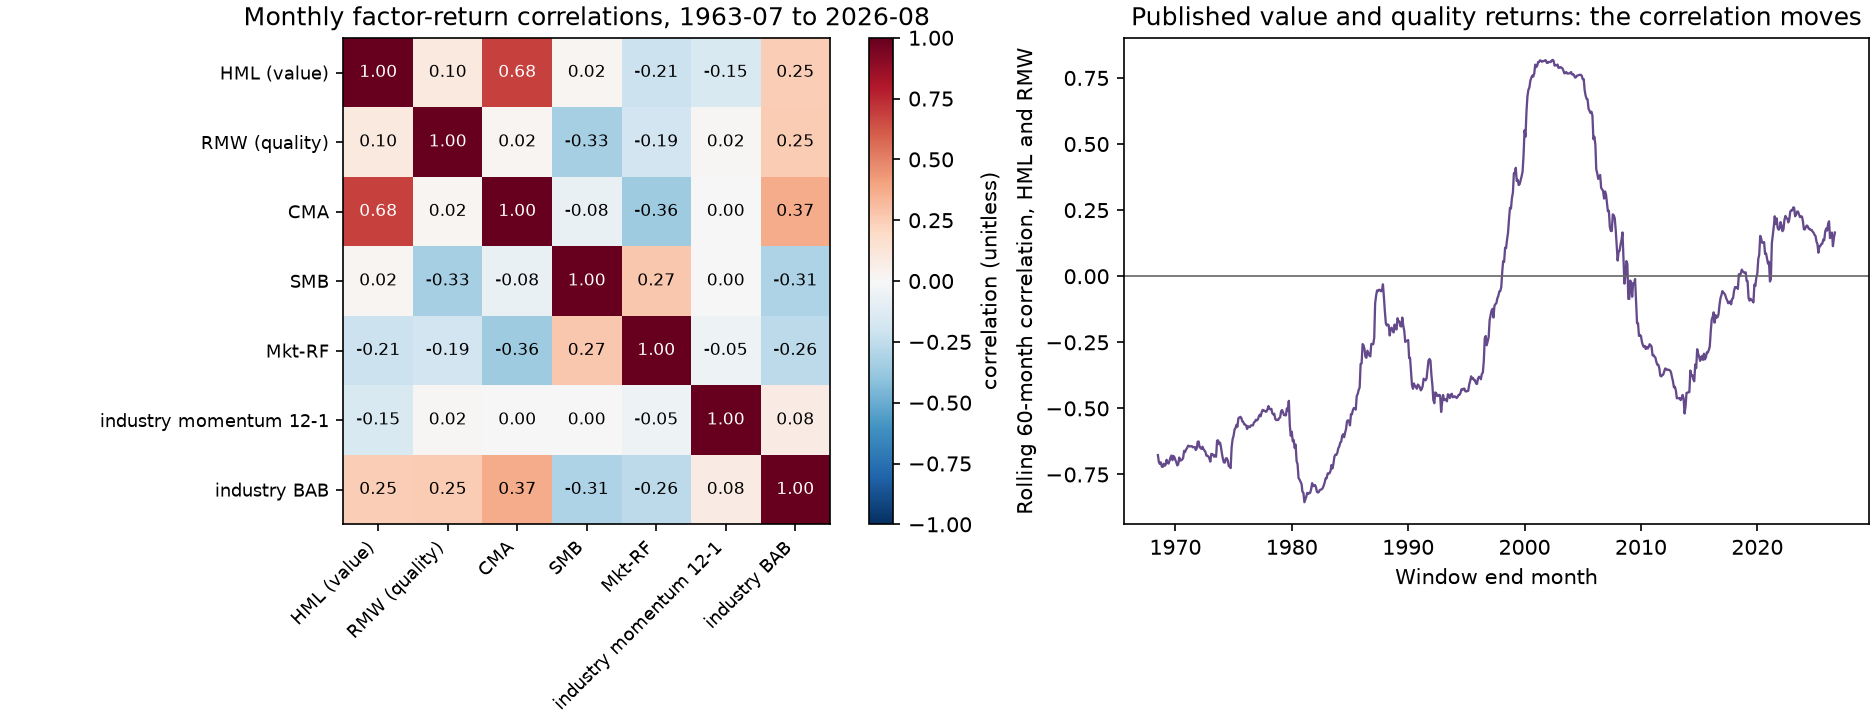
Figure 28-4: Correlations among published factor returns. Left: monthly return correlation matrix for the five FF5 factors and two strategies constructed from 10 industry portfolios (cross-sectional momentum 12–1 and BAB), from 1963-07 through 2026-08 (758 months). Right: rolling 60-month correlation between HML and RMW. The rolling correlation ranges from
11. Real-market example
Data and limits. This uses the French five-factor (2×3) monthly data frozen on 2026-10-05 (processed CSV SHA-256: 833bd925b49651428781c789c13a6ac7454d4676449e6d119782050046a57eea; 758 months, 1963-07 through 2026-08), plus the French 10-industry and FF3 snapshots used in Chapters 25 and 27 (see Chapter 25 source notes for processed hashes). Factor construction follows the French database's five-factor description: HML is one-half (Small Value + Big Value) minus one-half (Small Growth + Big Growth); RMW and CMA (conservative minus aggressive investment) are formed similarly. These are published aggregate returns, not stock-level signals, point-in-time versions, or executable trades. The two “industry strategies” are built from 10 value-weighted industry portfolios: cross-sectional 12–1 momentum (quintiles, two industries per bucket,
Correlation matrix (758 months).
| HML | RMW | CMA | SMB | Mkt-RF | Industry momentum | Industry BAB | |
|---|---|---|---|---|---|---|---|
| HML (value) | 1.00 | 0.10 | 0.68 | 0.02 | 0.25 | ||
| RMW (quality) | 0.10 | 1.00 | 0.02 | 0.02 | 0.25 | ||
| CMA | 0.68 | 0.02 | 1.00 | 0.00 | 0.37 | ||
| SMB | 0.02 | 1.00 | 0.27 | 0.00 | |||
| Mkt-RF | 0.27 | 1.00 | |||||
| Industry momentum 12–1 | 0.02 | 0.00 | 0.00 | 1.00 | 0.08 | ||
| Industry BAB | 0.25 | 0.25 | 0.37 | 0.08 | 1.00 |
Unstable correlation. HML/RMW correlation is 0.095 over the full sample;
Equal-risk average. Take the monthly return series for HML, RMW, and industry momentum; divide each by its own expanding standard deviation through the prior month (at least 60 months, using only data through signal_time and is not a usable method. The numerical closeness is specific to this dataset.
What can and cannot be said. We can say that the published value and quality factors have opposite correlations across subperiods from 1963 through 2026, illustrating short-window estimation uncertainty and cross-period drift; this does not imply that every 60-month matrix is necessarily unstable. We can also say that the in-sample Sharpe of an equal-risk average of three low-correlation return series is close to the simplified formula. We cannot say: (1) that this portfolio has a 0.6 Sharpe out of sample; the value uses three components and 698 in-sample months, HML and RMW are published revised histories, and industry momentum uses only 10 industries; (2) that value and quality factors are “crowded,” because this chapter has no holdings, short-borrow rates, or fund-flow data; (3) how a stock-level multi-factor portfolio performs, because the stock-level experiment here is only a constructed panel; or (4) anything about costs, capacity, or tradability.
12. Common errors
Error 1: Standardizing with a full-sample fit. Using full-sample mean and standard deviation for each stock's time series makes row
Error 2: Winsorizing with quantiles from the entire panel. Pooling all dates to calculate the 1st and 99th percentiles uses other dates' distributions, including the future. Fix: compute cross-sectional quantiles separately for each date (winsorize_cross_section).
Error 3: Choosing winsorization or z-score parameters by evaluation-period IC. The choice of quantiles (1%/99% or 5%/95%), degrees of freedom, and a second winsorization can all look different in the evaluation period. Fix: specify them in advance and record variants in the ledger (Chapter 22).
Error 4: Neutralizing with hindsight industry labels. Industry classifications can be revised; a label unavailable at signal_time introduces future information. Fix: use the version known at the time (date-indexed groups) and report the share of missing labels.
Error 5: Removing true signal through neutralization. If an industry shift itself carries returns (real industry momentum or a value effect), neutralization removes it. Fix: state whether neutralization is a research hypothesis and report IC before and after; do not transfer a favorable constructed-world result to real data.
Error 6: Using too many controls. Every added control consumes degrees of freedom; on a date with eight stocks, ten industry indicators leave no residual variation. Fix: return NaN when degrees of freedom are insufficient (the neutralize rule) and report how many dates were dropped.
Error 7: Confusing signal neutralization with linear-constraint projection. They agree for weights proportional to the signal (Section 8.3) and differ for quantile weights (Section 10: mean maximum industry net is 0.053 versus
Error 8: Choosing orthogonalization order after evaluation. Order can change IC by 36% (Section 8.4). Fix: state a rule in advance, such as “the foundational factor comes first,” and record all orders.
Error 9: Choosing composite weights from evaluation-period performance. Discovery-period IC-proportional weights beat equal weights in the holdout in only 31.7% of worlds (Section 10); the best single factor does so in 3.3%. Fix: fix weights in advance, or estimate them in discovery and evaluate them in an independent holdout, with the process recorded.
Error 10: Failing to report coverage and scale after zero fill or reweighting. In this constructed random-missingness sample, reweighting makes single-factor names appear in the top quintile 1.55 times as often as their baseline share; zero fill pushes them toward the middle (0.62 times). Fix: set a minimum factor count, report coverage and the single-factor share, and test sensitivity to both treatments.
Error 11: Configuring weights from one 60-month correlation matrix. HML/RMW correlation is
Error 12: Confusing signal correlation with return correlation. Signal correlation (same-date cross-section) determines composite IC; return correlation (time series of factor returns) determines diversification. Their signs can differ (constructed panel: signal correlations of
Error 13: Treating position overlap as proof of crowding. Top-quintile overlap is only one aspect; assessing crowding requires holdings, short-borrow, and fund-flow data (Section 6.9).
13. Quant research application
Multi-factor workflow contract (Project 4 signal layer).
| Step | Transform | Which date's data? | Who fixes the parameter, and when? |
|---|---|---|---|
| 1 | Point-in-time version selection (Chapters 24–26, latest_available_values) |
Available before signal month | Plan specifies availability rule |
| 2 | Same-date winsorization (P4: 1%/99%, at least 30 field values) | Same-date cross-section | Fixed in the plan before seeing returns |
| 3 | Same-date neutralization (industry and log market capitalization) | Same-date cross-section, with industry label version known at the time | Plan |
| 4 | Same-date z-score (P4 uses ddof=1 and minimum 10; the hand-calculation example uses minimum 3) |
Same-date cross-section | Plan |
| 5 | Combination (equal weights, minimum 2 factors, reweight over available factors) | Same date | Plan; weight variants recorded in the ledger |
| 6 | Quantile weights or weights proportional to the signal; linear constraints (Chapter 21 projection) | Same date | Plan |
| 7 | Evaluation: IC, quantile returns, turnover, exposures | Next-month label; independent holdout | Discovery/holdout split fixed in the plan |
Research workflow (constructed panel with known data-generating process). Frozen plan: hypothesize that “the equal-weight composite of three processed factors has positive same-date Rank IC with next-month returns and exceeds each single factor's IC”; primary measure is the composite's mean Rank IC and its
Variants in the ledger. Winsorization (yes/no) × neutralization (yes/no) × combination (equal weight, true loadings, four sequential orders) × missing-data treatment (four options) × constraint (three options). Not every combination was evaluated, but every evaluated variant must be recorded; all reported
Constraints for Project 4. (1) Use only data available by the signal month; same-date transforms use that date's cross-section. (2) Use industry labels known at the time. (3) Fix weights, winsorization quantiles, minimum factor count, and orthogonalization order in advance. (4) Report coverage per factor and composite, shares of dropped or imputed names, and the share of single-factor names at both tails. (5) Report IC before and after neutralization, plus industry and size exposures. (6) State whether the constraint is signal neutralization or weight projection. (7) Report correlation uncertainty and values for multiple periods. (8) Do not claim “crowding” without actual holdings data.
13.1 How to read the C13 protocol correction alongside historical results
The original constructed panel, figures, and French aggregate diagnostics in Sections 9–11 remain tied to their own inputs; they are not rewritten as a new P4 run. The old A5/A6 P4 projected over all 240 columns and then filtered by listing status. Its historical record includes 1,842 name-months zeroed out and a maximum industry net position of 0.0280748663 after filtering. This exposed a mismatch between protocol and implementation; a claim that “industry projection was already applied” does not replace a support-set check.
C13 corrected the protocol while preserving the meaning of the original configuration: enforce the 60-name threshold at preprocessing and portfolio entry; apply optional industry projection only on the signal-time listed support set; restore configured gross of 2 after the homogeneous projection; explicitly record degenerate cases as cash; and report A6 target and actual-holding residuals separately. The original seven fields, ranking and combination formulas, data-generating process, seed, and two frozen configurations are unchanged. The new source hashes, old/new sample, weight, return, and cost differences, and checks are documented in the accepted P4 protocol-alignment note.
This correction is a normative alignment made after the old results had been seen. It is not a new blind preregistration, independent market test, or tuned strategy. Keep favorable and unfavorable return changes. Restoring configured gross and neutrality does not establish alpha, borrow availability, or capacity. Chapter 29 remains responsible for execution ledgers and cash/fee reconciliation; execution-day states do not flow backward into the signal.
14. Chapter summary
A multi-factor workflow has three layers: preprocessing (same-date cross-sectional transforms that change scale, outliers, and unwanted exposures), combination (weights fixed in advance), and constraints (portfolio-level exposures). When a signal contains a component unrelated to returns, Pearson IC is attenuated by
15. Exercises
28-E01 (calculation). Same-date signals for 11 stocks are
28-E02 (calculation). There are 8 stocks; industry A is the first four and industry B the last four. Signal
28-E03 (calculation). Use the 28-E02 signal as weights
28-E04 (calculation). Two standardized signals have
28-E05 (calculation). Four equally weighted factors each have mean zero and variance one, and every pair of distinct factors has correlation 0.25. Assume missingness is completely at random (MCAR), so these conditional moments still hold within every available subset, given the missingness mask. The overall average correlation of four factors alone would not be sufficient. A name has
28-E06 (calculation). A stock's signal sequence is signal_time.
28-E07 (calculation). Four factors each have Sharpe ratio 0.4 and average correlation 0.25. Find the Sharpe ratio of the equal-risk average. What average correlation would make it 0.6? What is the lower bound on average correlation?
28-E08 (conceptual). For each method, say whether it is available at signal_time and why: (a) z-score each date's cross-section; (b) z-score each stock's signal time series using its full-sample mean and standard deviation; (c) winsorize using 1st and 99th percentiles calculated over the whole panel; (d) neutralize within the date using industry labels known in the signal month; (e) orthogonalize in the order with the highest evaluation-period IC; (f) scale factor returns by an expanding standard deviation through the prior month.
28-N01 (support set, budget, and causal clock). Use the four names, weights, and industry labels from Section 8.8. (a) When a is unlisted, report industry net, total net, and gross after full-column projection followed by masking, then give the weights and residuals from projecting only on b, c, and d and restoring gross to 2. (b) All four names are listed, initial quantile weights are
16. Programming exercises
28-P01. Reproduce 28-E02 using neutralize: assert the residuals and the raw and neutralized ICs. Then add a size-control column and assert that residuals are orthogonal to size and sum to zero within each industry. Acceptance: all four assertions pass.
28-P02. Simulate two standardized signals with correlation 0.5 and one label (orthogonalize in both orders, calculate the composite IC, and compare it with sequential_orthogonal_ic. Acceptance: each order's IC is within 0.006 of its formula, and the second order's IC is more than 0.006 above the first.
28-P03. Simulate 100 worlds, each with 300 stocks and 120 months. Three mutually independent standard-normal signals contribute equally to the label. Estimate each factor's mean IC over the first 60 months, use its positive part as a weight (normalized), and compare mean IC for tuned versus equal weights over the next 60 months. Acceptance: mean holdout IC under equal weights exceeds the tuned mean, and tuning beats equal weights in fewer than 40% of worlds.
17. Challenge problems
28-C01 (derivation). For two standardized signals, prove that the IC difference after sequential orthogonalization is
and discuss which order is better when
28-C02 (open-ended). Write a frozen multi-factor workflow plan and data-gap table for Project 4. List the data date used at every step (version selection, winsorization, neutralization, z-scoring, combination, constraints, evaluation), who fixes each parameter and when, required fields (including historical industry classifications and market capitalization), and the number of variants recorded. Explain which conclusions cannot be made without those data. Give the three checks required before combination: correlations, coverage, and point-in-time eligibility. Grading: workflow table (30), gap table (30), unsupported conclusions (20), pre-combination checks (20).
18. Complete answers and worked solutions
28-E01. Sorted values are
28-E02. Industry A's mean is 1.5, giving residuals
28-E03.
28-E04. Equal weight:
28-E05. By the stated equicorrelation and MCAR assumptions, any available subset, conditional on its mask, retains zero means, unit variances, and pairwise correlation groups have the same distributional shape and missingness is independent of values, the larger variance can make them overrepresented beyond a fixed symmetric tail threshold; variance alone cannot prove an arbitrary tail probability. Under zero fill, their variance is
28-E06. The first three observations are signal_time.
28-E07.
28-E08. (a) Usable with conditions: same-date fields and industry-label versions and their parameter policy must be known at signal_time, and only that cross-section may be used; being in one row does not itself establish point-in-time eligibility. (b) Not usable: the full-sample mean and standard deviation include the future. (c) Not usable: this uses distributions from other dates, including future dates; calculate cross-sectional quantiles separately for each date. (d) Usable if the industry-label version was known at signal_time. (e) Not usable: choosing order from evaluation results tunes to the test set; fix the order in advance and record all variants. (f) Usable: an expanding standard deviation through the prior month uses no future data.
28-P01
import numpy as np
import pandas as pd

from quant_course.factor_preprocessing import neutralize

cols = list("abcdefgh")
sig = pd.DataFrame([[2, 0, 1, 3, 10, 8, 12, 6.0]], index=pd.period_range("2026-06", periods=1, freq="M"), columns=cols)
y = np.array([0.06, 0.02, 0.04, 0.08, -0.01, -0.03, 0.01, -0.05])
groups = pd.Series(list("AAAABBBB"), index=cols)
res = neutralize(sig, groups=groups)
assert np.allclose(res.iloc[0], [0.5, -1.5, -0.5, 1.5, 1.0, -1.0, 3.0, -3.0])
raw_ic, neutral_ic = np.corrcoef(sig.iloc[0], y)[0, 1], np.corrcoef(res.iloc[0], y)[0, 1]
assert abs(raw_ic + 0.5445) < 1e-4 and abs(neutral_ic - 0.5108) < 1e-4
size = pd.DataFrame([[1.0, 2.0, 0.5, 3.0, 2.5, 1.5, 0.2, 4.0]], index=sig.index, columns=cols)
res2 = neutralize(sig, groups=groups, controls={"size": size})
assert abs(np.dot(res2.iloc[0], size.iloc[0])) < 1e-10 and abs(res2.iloc[0].groupby(groups).sum()).max() < 1e-10
28-P02
import numpy as np

from quant_course.factor_preprocessing import sequential_orthogonal_ic

rng = np.random.default_rng(1)
n = 400_000
z = rng.multivariate_normal([0.0, 0.0], [[1.0, 0.5], [0.5, 1.0]], size=n)
y = 0.04 * z[:, 0] + np.sqrt(1 - 0.04 ** 2) * rng.normal(size=n)               # corr(z1, y) = 0.04, corr(z2, y) = 0.02


def sequential(first: int, second: int) -> float:
    e = z[:, second] - np.polyval(np.polyfit(z[:, first], z[:, second], 1), z[:, first])    # residual of the second on the first
    return float(np.corrcoef(z[:, first] + e / e.std(), y)[0, 1])


a, b = sequential(0, 1), sequential(1, 0)
assert abs(a - 0.0283) < 0.006 and abs(b - 0.0386) < 0.006 and b - a > 0.006
assert abs(a - sequential_orthogonal_ic([0.04, 0.02], [[1, 0.5], [0.5, 1]], [0, 1])) < 0.006
28-P03
import numpy as np

rng = np.random.default_rng(5)
worlds, n, months = 100, 300, 120


def mean_ic(sig: np.ndarray, lab: np.ndarray) -> np.ndarray:
    s = (sig - sig.mean(axis=1, keepdims=True)) / sig.std(axis=1, keepdims=True)
    l = (lab - lab.mean(axis=1, keepdims=True)) / lab.std(axis=1, keepdims=True)
    return (s * l).mean(axis=1)                                                    # per-month Pearson IC


hold_eq, hold_tuned = [], []
for _ in range(worlds):
    z = rng.normal(size=(months, n, 3))
    label = 0.05 * z.sum(axis=2) + rng.normal(size=(months, n))                    # three equally good, independent signals
    half = months // 2
    disc = np.array([mean_ic(z[:half, :, k], label[:half]).mean() for k in range(3)])
    w = np.maximum(disc, 0.0)
    w = w / w.sum() if w.sum() > 0 else np.ones(3) / 3
    hold_eq.append(mean_ic(z[half:].sum(axis=2), label[half:]).mean())
    hold_tuned.append(mean_ic(z[half:] @ w, label[half:]).mean())
hold_eq, hold_tuned = np.array(hold_eq), np.array(hold_tuned)
assert hold_eq.mean() > hold_tuned.mean() and (hold_tuned > hold_eq).mean() < 0.4
28-C01. Let
28-C02 (grading guidance and reference). Available course data include French five-factor returns, 10-industry monthly returns, and a constructed panel. Missing are historical point-in-time industry classifications, market capitalization, and point-in-time versions of stock-level fundamentals. For each row in the workflow table, state the transformation, data date, parameters, and who fixes them and when. For each gap, state the field (industry classification, log size, or raw field for each factor), required real source, time fields, and missingness rule. Unsupported claims include stock-level multi-factor portfolio returns, capacity or costs, any crowding conclusion, or treating constructed-panel IC values as real IC. The three checks before combination are: (1) correlations—same-date signal and factor-return correlations, including their values across periods; (2) coverage—coverage for each factor and whether missingness is related to the signal; and (3) point-in-time eligibility—each field's available_at, industry-label version, and the data date used by every transformation.
28-N01 (complete answer). (a) After masking, weights are
19. Further reading
- Must Know: Kenneth French Data Library, five-factor description; review the construction and sample conditions for HML, RMW, CMA, and SMB.
- Must Know: Chapter 22 of this course, the experiment ledger and multiple testing (Bonferroni, Holm, Benjamini–Hochberg); every degree of freedom in a multi-factor workflow belongs in the ledger.
- Should Know: Gelman and Loken on forking paths (working paper, referenced in Chapter 22 source notes); read their discussion of analyses being selected in response to data.
- Should Know: Chapter 21's
project_to_constraintsand exposure reporting; review the linear-constraint projection derivation. - Advanced: Asness, Moskowitz, and Pedersen on combining value and momentum across asset classes; Fama and French (2015) on redundancy of the value factor in the five-factor model. This chapter has not reviewed their findings on factor correlation and combination.
- Optional: Any public fund-holdings disclosure, to practice measuring the overlap between the top quintiles of two factors. This course has no holdings data.
20. References
Citation keys and reading scope are listed in source_notes.md.
- CH28_FF5_PAGE: Kenneth R. French Data Library, “Description of Fama/French 5 Factors (2x3)” (construction and sample conditions for HML, RMW, CMA, SMB, and the market).
- CH22_GELMANLOKEN2013: Gelman, A. and Loken, E. (2013), unpublished working paper (see Chapter 22 source notes).
- CH25_FRENCH_IND: French 10-industry and FF3 snapshots (Chapter 25 source notes), plus the constructed 12–1 momentum and BAB strategies (Chapters 25 and 27).
- FRENCH: Frozen French five-factor snapshot (data/manifests/french_factors_2026-10-05.json).