CHAPTER 25/ 45
Momentum
Through line: Turn “past winners keep winning” into precisely bounded windows, directionally explicit positions, and returns whose costs can be measured. Distinguish cross-sectional momentum (XSMOM) from time-series momentum (TSMOM, also called trend); they are different strategies. Prerequisites: Chapter 11 (returns and compounding) and Chapter 23 (cross-sectional research). After this chapter, you should be able to write the exact signal-month endpoints of 12–1 momentum without an off-by-one error; explain the difference between
and a sum; construct both a winner-minus-loser cross-sectional portfolio and a time-series trend portfolio; reduce turnover with overlapping holdings and derive the turnover formula; identify data-definition problems involving stock splits, futures rolls, and continuous contracts, and survivorship in the sample; and report results using real monthly returns for 10 industries, including negative results, costs, and crash states.
1. Chapter goals
Readers should be able to:
- For signal month
(at month-end), write the 12–1 formation interval (months , 11 months in all), the skipped month ( ), and the holding interval ( ); explain that the 12–0 time-series momentum window of Moskowitz, Ooi, and Pedersen (2012; hereafter MOP) includes the most recent month. - Calculate by hand and distinguish
, , and , and give an example in which sum-based and compound-return rankings are reversed. - Construct a cross-sectional momentum portfolio (long the highest formation-return bucket and short the lowest) and a time-series momentum portfolio (go long or short each asset according to the sign of its own past return, with positions scaled by ex ante volatility). Explain net exposure (the sum of signed weights, equivalently long weights minus the absolute short weights), gross exposure (the sum of absolute weights), and the relevant benchmark for each.
- Construct a portfolio with
months of overlapping holdings, derive the adjacent-month weight change , and compare turnover (the monthly sum of absolute weight changes) and costs for using real industry data. - Identify and correct three data-definition errors: false losers caused by unadjusted stock splits and dividends, false returns created by stitching futures prices across rolls, and survivorship bias from backtesting only the stocks that exist today.
- Report 12–1, window variants, a
grid (including a Bonferroni threshold), time-series trend versus an always-long benchmark, and crash states for 10 industry portfolios; state clearly what cannot be concluded.
Completion criterion: Every momentum signal should include a timeline marking formation months, the skipped month, signal_time, trade_time, and the holding month. You should be able to explain what changes when the window is one month longer or shorter than the standard definition.
2. Why Quant needs this
Momentum is the factor in Part IV most easily “implemented incorrectly.” Its definition fits in one sentence (“assets that rose more in the past keep rising”), but moving a window endpoint by one month, summing returns instead of compounding, failing to adjust prices for splits, stitching futures prices directly, or using a universe of only surviving companies can all change the result without producing an error. Momentum also has a clear crash risk: strategies with positive long-run means can suffer very large losses in a small number of months. Those losses cluster in rebounds after market declines, so reporting only the mean and its
The chapter proceeds as follows: first make the window endpoints and compounding exact (Sections 6.1–6.2); then specify the two portfolios using overlapping holdings and volatility scaling (Sections 6.3–6.4); explain why their risks and benchmarks differ (Section 6.5); examine crash states (Section 6.6); address data definitions (Sections 6.7–6.8); and finish with a full report on 10 industry portfolios (Section 11). We use the period-by-period IC, quantile portfolios, and inference methods chosen for the dependence structure from Chapter 23; the experiment ledger in Chapter 22 constrains window searches; Chapter 27 extends the futures-roll issue to carry.
3. Intuition
An asset that rose the most over the past year tends, on average, to rise a little more next month than an asset that fell the most over the past year: this is cross-sectional momentum. If an asset’s own price has trended upward over the past year, it is more likely to continue rising next month: this is time-series momentum, also called trend. The first compares assets’ relative positions and is always one long and one short, with net position near zero. The second looks only at each asset on its own; if most assets are rising, the portfolio is net long and its return includes the market’s overall moves.
The intuition has two further details. First, why skip the most recent month? Individual-stock monthly returns exhibit short-term reversal: last month’s winners often give some of it back next month, in connection with liquidity and market microstructure (AMP 2013, printed p. 936). Thus, the “1” in 12–1 removes the most recent month from the formation period. Second, why consider the holding period? Signals update each month. Replacing the entire portfolio every month creates high turnover; instead, let each new vintage occupy
Simplifying boundary: the real-data example in this chapter has only 10 industry portfolios (revised value-weighted monthly returns). They do not exhibit the microstructure reversals of individual stocks; the cross section is small; and the observations are not an executable trade series. This chapter does not support conclusions about individual stocks.
3.1 Fixing the 12–1 clock with actual calendar months
4. Mathematical foundations
Notation. Asset
Compounded return. For a set of months
Time-series signal. Asset
Overlapping holdings. Form one new “vintage” (a batch of target weights)
Bear-market state.
Frequency convention: monthly. signal_time is month-end; execution is at the next tradable time; the return interval is month
5. Formal definitions
Formation interval, skipped month, and holding interval. The formation interval contains the months used to calculate the signal. For 12–1, these are
Cross-sectional momentum. On a given date, rank assets by their formation returns, buy the highest bucket, and sell the lowest (Jegadeesh and Titman 1993 use deciles). Its direction follows relative ranks rather than the sign of each asset’s absolute return; portfolio market risk still depends on the two legs’ exposures.
Time-series momentum (TSMOM). Each asset’s own past-return sign determines its long or short direction, and the position size is inversely proportional to ex ante volatility (Moskowitz, Ooi, and Pedersen 2012, equation (5):
Short-term reversal. The negative predictive relation of the most recent month’s return, associated with liquidity and market microstructure for individual stocks (AMP 2013). This chapter tests whether it appears in industry portfolios.
Trend. Used synonymously with time-series momentum: persistence in an asset’s own price direction.
Momentum crash. Sustained or extreme negative returns in momentum strategies, concentrated in rebound months after market declines (Daniel and Moskowitz 2014).
Rebalancing and overlapping holdings. Update signals and adjust positions monthly. Overlapping holdings replace a vintage share equal to
Total return, price return, and adjusted prices. Price return includes only price changes; total return also accounts for dividends and splits. An unadjusted price after a split treats the split as a crash.
Roll and continuous contract. Before a futures contract expires, move to the next contract. A “continuous price” made by joining prices of different contracts has a jump on the roll date; that jump is not a return earned by holding any one contract.
Survivorship bias. A backtest includes only companies that still exist, omitting companies (including those later delisted) that were investable at each historical signal_time.
6. Derivations
6.1 Exact endpoints for 12–1
Signal month
using months formation_return(returns, window=11, skip=1) is exactly
6.2 Why
Returns compound over time: principal of 1 becomes formation_return sums log1p for simple returns and then applies expm1; a missing return cell or insufficient history makes the window NaN. A missing calendar-month row violates the continuous-index requirement and raises an error.
6.3 Turnover of overlapping-holdings portfolios
Form a new batch of weights
because
Each vintage has gross exposure of 2 (1 per leg), so
6.4 Time-series momentum exposure and benchmark
Weights are
6.5 Cross-sectional versus time-series momentum
Cross-sectional momentum is relative: equal long and short legs give zero net exposure and balance nominal capital. Its market beta is
6.6 Crash states: conditional means
Classify each signal month as bear or non-bear according to whether the market’s cumulative return over the prior 24 months is negative. Let the next-month conditional means of cross-sectional momentum be
6.7 Prices, splits, dividends, and total return
Let split ratio
6.8 Roll stitching: a continuous price is not a return
Here and in Section 8.5 and 25-E06, chaining within-contract price ratios defines a return index: ignore fees and collateral interest, fully collateralize each segment at its starting contract price, and adjust notional exposure with wealth before multiplying the wealth factors. A fixed one-contract position instead requires currency P&L for each segment and an explicit capital denominator; it is not the same capital return.
Contract A is priced at 100 and 102 at
7. Financial interpretation
This chapter does not decide where momentum returns come from. Jegadeesh and Titman (1993) report winner-minus-loser returns for U.S. individual stocks in 1965–1989; Asness, Moskowitz, and Pedersen (2013) use the same simple measure across multiple asset classes; Moskowitz et al. (2012) report time-series momentum that persists for 1 to 12 months and partially reverses across 58 futures. This chapter has not read the original papers in enough detail to restate their explanations (such as underreaction to information or risk compensation). The Quant requirement is that, whatever the explanation, the signal be constructible at signal_time, costs be included, and crashes be reported separately.
Industry momentum differs from individual-stock momentum. The skipped month in 12–1 is used for individual stocks to avoid short-term reversal (AMP 2013, printed p. 936). AMP also notes stronger momentum without skipping the most recent month for equity-index futures and currencies (printed p. 937). An industry portfolio is a value-weighted average of many stocks, so bid-ask spreads and liquidity-related microstructure effects are averaged out. The industry results here are consistent with that distinction: the 1–0 window (last month’s return) has a long-short monthly mean of window=1, skip=1, using only month
Turnover is a major source of momentum costs. Monthly target-weight turnover for cross-sectional 12–1 is 0.904 (gross exposure 2). Assuming 10 bp per unit of turnover gives a monthly cost of 9 bp and reduces 0.519% to 0.427%.
Report crash risk alongside the mean. The cumulative compound return of cross-sectional 12–1 on the 10 industries has a maximum drawdown of about 64% at its worst point. Its 10 worst monthly losses range from 13.6% to 34.8%, with 7 following a bear state. A strategy with a positive mean may still be impossible for an investor to hold.
The time-series trend return contains market exposure. In the industry sample, trend signals are positive in most asset-months (67.4% of assets are long); average net exposure is 1.05, so the 1.391% monthly mean includes an equity risk premium. Relative to always long, the mean difference is -0.389% per month with t=-1.05; no statistically clear positive increment is observed. This is not an estimated regression alpha.
7.1 Three questions and three mechanisms to test
Cross-sectional momentum asks: “On the same date, do past winners outperform past losers next month?” It needs a common asset universe and buys winners while selling losers. Even if every stock fell in the past, it can still take both sides as long as relative ranks are available. Time-series momentum asks: “Does this asset’s own past direction continue next month?” It uses zero return, or another explicitly stated excess-return threshold, as the cutoff; when all assets point the same way, the portfolio can be net long or net short. Short-term reversal asks: “Do last month’s winners give back their gains?” If the signal is defined as the negative of the most recent month’s return, a higher value means a larger recent decline. This is a different specification from 12–1, which excludes the latest month; one name cannot stand in for the other.
Underreaction is one hypothesis: information takes time to enter prices, so past trends continue. It can be tested using information events defined in advance and subsequent drift. Risk compensation is another: winners and losers have different state exposures, and returns come with losses during some rebounds. The crash-state description in Section 11 can motivate such a test, but cannot prove the cause. Measurement proxies may also arise from industry trends, stale trading, or liquidity; they require the corresponding universe and controls for available quotes. All three can coexist with positive historical returns; past profits cannot decide among these explanations. These are research questions, not extensions of the original empirical findings.
Skipping a month is a specification set in advance, with the cost of giving up the most recent information; whether it helps depends on the asset and data definition. The positive 1–0 result for industry portfolios and the negative time-series difference versus always long are both retained. With individual stocks, futures, or currencies, inputs must be defined again. Do not choose the main specification after looking back at whichever of the 19 variants in this chapter performed best.
8. Numerical worked examples: calculate each step
All numbers are generated by hand_examples() and independently checked by qa/a5/claude/recompute/ch25_recompute.py. These are constructed teaching examples.
8.1 The 12–1 window: returns over fourteen months
An asset’s monthly simple returns over months 1–14 are
- Compounded return:
; sum: ; difference: 0.716 percentage points. - Shift the window one month earlier (months 1–11):
; shift it one month later (months 3–13, including the skipped month): ; include month 13 in a 12-month window (months 2–13, the 12–0 window): .
Interpretation: for the same asset, the signal differs by 2 to 7 percentage points across three erroneous windows. The 12–0 signal is 7 percentage points lower than 12–1 because the skipped month was
8.2 Cross-sectional momentum: six assets
The six assets’ 12–1 formation returns are
8.3 Time-series momentum: volatility scaling
Three assets have signals
8.4 Stock split and dividend
Constructed example from Chapter 3: the pre-split price is 100, 1 share splits into 2 shares (a U.S. 2-for-1 split), the post-split price is 51, and the dividend is 1 per new share. Total return is
8.5 Futures roll
Contract A:
8.6 Overlapping holdings and turnover
There are two assets and six months of vintage weights:
8.7 Bear-market state
All market monthly returns are
9. Python implementation
The window is calculated by formation_return in factor_signals.py (introduced in Chapter 22); portfolio construction and costs are in the new module momentum.py; cross-sectional bucketing, IC, and Newey–West inference reuse Chapter 23’s factor_research.py.
| Function | Input | Output and boundary |
|---|---|---|
formation_return |
Monthly return panel with a continuous PeriodIndex, window, skip |
Compounded formation return. Signal month |
cross_sectional_momentum_weights |
Return panel, window, skip, bucket count, holding months |
Average of the latest |
blend_vintages |
Weight panel, |
Rolling average; fewer than |
time_series_sign |
Excess-return panel, window, skip | |
ex_ante_volatility |
Return panel, window 36, minimum 12 | Annualized rolling standard deviation; a teaching substitute, not the daily exponentially weighted estimate in the original paper. |
tsmom_weights |
Sign, volatility, target volatility | |
strategy_returns |
Weights (at signal month), returns | Month- |
net_of_costs |
Gross returns, weights, unit cost | Gross return minus $c\times\sum |
trailing_bear_state |
Market total-return series, window | Mark 1 when the past 24 months (including the current month) compound to a negative return; insufficient window gives NaN. |
Default offline entry point (run from the I3 reader-package root):
.venv/bin/python run_notebook.py notebooks/ch25_momentum.ipynb
The default is RUN_FRENCH=False; it displays windows, compounding, CS/TS weights, and the 24-by-6 vintage identity with seed 2 (runs/execution_<stem>_<uuid>/. The notebook’s English-language layer and the package-wide paths are assembled in BIL23. The following full historical CLI and test references are not the default offline command:
.venv/bin/python code/ch25_momentum.py
.venv/bin/python -m pytest tests/test_ch25_momentum.py tests/test_ch25_workflow.py -q
Frequency is monthly; signal_time is month-end; execution is at the next tradable time; the return interval is month
Code segment one: 12–1 window and three erroneous windows (Section 8.1).
import numpy as np
import pandas as pd

from quant_course.factor_signals import formation_return

r = [0.03, -0.02, 0.05, 0.01, -0.04, 0.06, 0.02, -0.01, 0.04, 0.03, -0.02, 0.05, -0.06, 0.02]
frame = pd.DataFrame({"a": r}, index=pd.period_range("2020-01", periods=14, freq="M"))
s = pd.Period("2021-01", "M")                                    # month 13: signal at the end of this month
f121 = formation_return(frame, window=11, skip=1).loc[s, "a"]    # months 2..12
f120 = formation_return(frame, window=12, skip=0).loc[s, "a"]    # months 2..13, nothing skipped (time-series style)
early = np.prod(1 + np.array(r[0:11])) - 1                      # months 1..11
late = np.prod(1 + np.array(r[2:13])) - 1                       # months 3..13
assert abs(f121 - 0.177159) < 1e-6 and abs(f120 - 0.106530) < 1e-6
assert abs(early - 0.154737) < 1e-6 and abs(late - 0.129112) < 1e-6
assert abs(sum(r[1:12]) - 0.17) < 1e-12                          # the sum, 0.716 percentage points lower
print(round(f121, 4), round(f120, 4), round(early, 4), round(late, 4))
Code segment two: sum and compound return produce opposite rankings (Section 6.2).
import numpy as np
import pandas as pd

from quant_course.factor_research import rank_cross_section
from quant_course.factor_signals import formation_return

idx = pd.period_range("2020-01", periods=2, freq="M")
returns = pd.DataFrame({"X": [0.50, -0.50], "Y": [0.0, 0.0]}, index=idx)
compound = formation_return(returns, window=2, skip=0).iloc[-1]
total = returns.sum()
assert np.isclose(total["X"], 0.0) and np.isclose(total["Y"], 0.0)                              # sums tie
assert np.isclose(compound["X"], -0.25) and np.isclose(compound["Y"], 0.0)                      # compounding separates them
assert np.isclose(np.log1p(returns["X"]).sum(), np.log(0.75))                                   # log returns add up to the compound return
assert list(rank_cross_section(compound.to_numpy())) == [1.0, 2.0]                              # X is the loser
print(compound.round(4).to_dict())
Code segment three: six-asset cross-sectional and time-series weights (Sections 8.2 and 8.3).
import numpy as np
import pandas as pd

from quant_course.factor_research import quantile_long_short_weights
from quant_course.momentum import tsmom_weights

idx = pd.period_range("2026-06", periods=1, freq="M")
names = list("ABCDEF")
formation = pd.DataFrame([[0.30, 0.12, 0.05, -0.02, -0.10, -0.25]], index=idx, columns=names)
w = quantile_long_short_weights(formation, 3).iloc[0]                  # terciles of 6 names: top 2 long, bottom 2 short
nxt = np.array([0.02, 0.03, 0.01, 0.00, 0.01, -0.02])
np.testing.assert_allclose(w.to_numpy(), [0.5, 0.5, 0, 0, -0.5, -0.5])
assert abs(w.to_numpy() @ nxt - 0.03) < 1e-12 and abs(w.sum()) < 1e-12 and abs(w.abs().sum() - 2.0) < 1e-12

sig = pd.DataFrame([[1.0, -1.0, 1.0]], index=idx, columns=list("xyz"))
vol = pd.DataFrame([[0.10, 0.20, 0.40]], index=idx, columns=list("xyz"))
tw = tsmom_weights(sig, vol, target_vol=0.40).iloc[0]
np.testing.assert_allclose(tw.to_numpy(), [4 / 3, -2 / 3, 1 / 3])
assert abs(tw.abs().sum() - 7 / 3) < 1e-12 and abs(tw.sum() - 1.0) < 1e-12                       # gross 2.33, net 1.0: not market neutral
assert abs(tw.to_numpy() @ np.array([0.01, -0.02, 0.03]) - 0.036667) < 1e-6
print(tw.round(3).to_dict())
Code segment four: turnover formula for overlapping holdings,
import numpy as np
import pandas as pd

from quant_course.momentum import blend_vintages

rng = np.random.default_rng(2)
idx = pd.period_range("2020-01", periods=24, freq="M")
vint = pd.DataFrame(rng.choice([-0.5, 0.0, 0.5], size=(24, 6)), index=idx)          # arbitrary vintage weights
for K in (1, 3, 6):
    blended = blend_vintages(vint, K)
    turnover = blended.diff().abs().sum(axis=1, min_count=1)
    formula = pd.Series([np.abs(vint.iloc[i] - vint.iloc[i - K]).sum() / K for i in range(len(vint))], index=idx)
    np.testing.assert_allclose(turnover.iloc[K:].to_numpy(), formula.iloc[K:].to_numpy(), atol=1e-12)
    assert turnover.iloc[:K].isna().all()                                      # no turnover before K vintages exist
print("turnover = ||w_s - w_(s-K)||_1 / K holds for K = 1, 3, 6")
Code segment five: stock split, dividend, and futures roll (Sections 8.4 and 8.5).
pre, ratio, dividend, post = 100.0, 2.0, 1.0, 51.0
assert abs((ratio * post + ratio * dividend) / pre - 1 - 0.04) < 1e-12 and abs(post / pre - 1 + 0.49) < 1e-12

a_prices, b_prices = [100.0, 102.0], [106.0, 107.0]
spliced = a_prices + b_prices
returns_spliced = [spliced[i + 1] / spliced[i] - 1 for i in range(3)]
tradable = [a_prices[1] / a_prices[0] - 1, b_prices[1] / b_prices[0] - 1]
assert abs(returns_spliced[1] - (106 / 102 - 1)) < 1e-15 and abs(returns_spliced[1] - 0.039216) < 1e-6      # fake return at the roll
assert abs(tradable[0] - 0.02) < 1e-15 and abs(tradable[1] - (107 / 106 - 1)) < 1e-15
print([round(x, 4) for x in returns_spliced], [round(x, 4) for x in tradable])
Code segment six: bear-state window boundary (Section 8.7) and “no future information” for industry weights.
import numpy as np
import pandas as pd

from quant_course.momentum import cross_sectional_momentum_weights, trailing_bear_state

idx = pd.period_range("2000-01", periods=30, freq="M")
m = pd.Series(0.01, index=idx); m.iloc[2] = -0.35                           # month 3 is the crash month
state = trailing_bear_state(m, window=24)
assert np.isnan(state.iloc[22]) and state.iloc[23] == 1.0 and state.iloc[25] == 1.0 and state.iloc[26] == 0.0

rng = np.random.default_rng(4)
returns = pd.DataFrame(rng.normal(0.01, 0.05, (48, 10)), index=pd.period_range("2010-01", periods=48, freq="M"))
base = cross_sectional_momentum_weights(returns, window=11, skip=1, n_buckets=5, hold_months=3)
shocked = returns.copy(); shocked.iloc[30:] = 0.3
changed = cross_sectional_momentum_weights(shocked, window=11, skip=1, n_buckets=5, hold_months=3)
pd.testing.assert_frame_equal(base.iloc[:31], changed.iloc[:31])           # months >= 30 cannot change weights decided up to month 30
print(state.iloc[[22, 23, 25, 26]].tolist())
10. Reading the figures
Figure 25-1: Window timeline. The horizontal axis is calendar month 1 through 15, with the signal formed at the end of month 13. Row one: cross-sectional 12–1 uses months 2–12 (blue, 11 months), skips month 13 (hatched), and holds in month 14 (orange). Row two: time-series 12–0 uses months 2–13 (purple, 12 months) and does not skip a month. Row three: a common error shifts the window one month earlier (gray, months 1–11). Interpretation: the three rows give different signals.
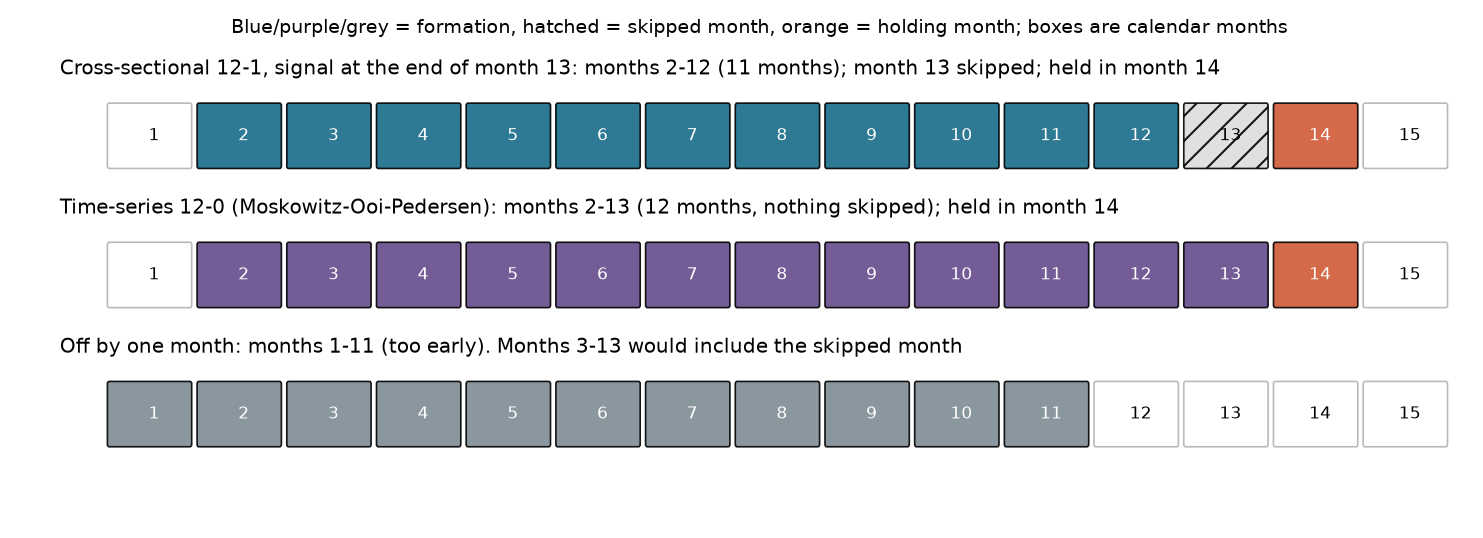
Figure 25-2: Cumulative portfolio returns and worst months for 10 industries. The left panel shows compound wealth (log scale, starting at 1) from July 1927: cross-sectional 12–1 long-short (
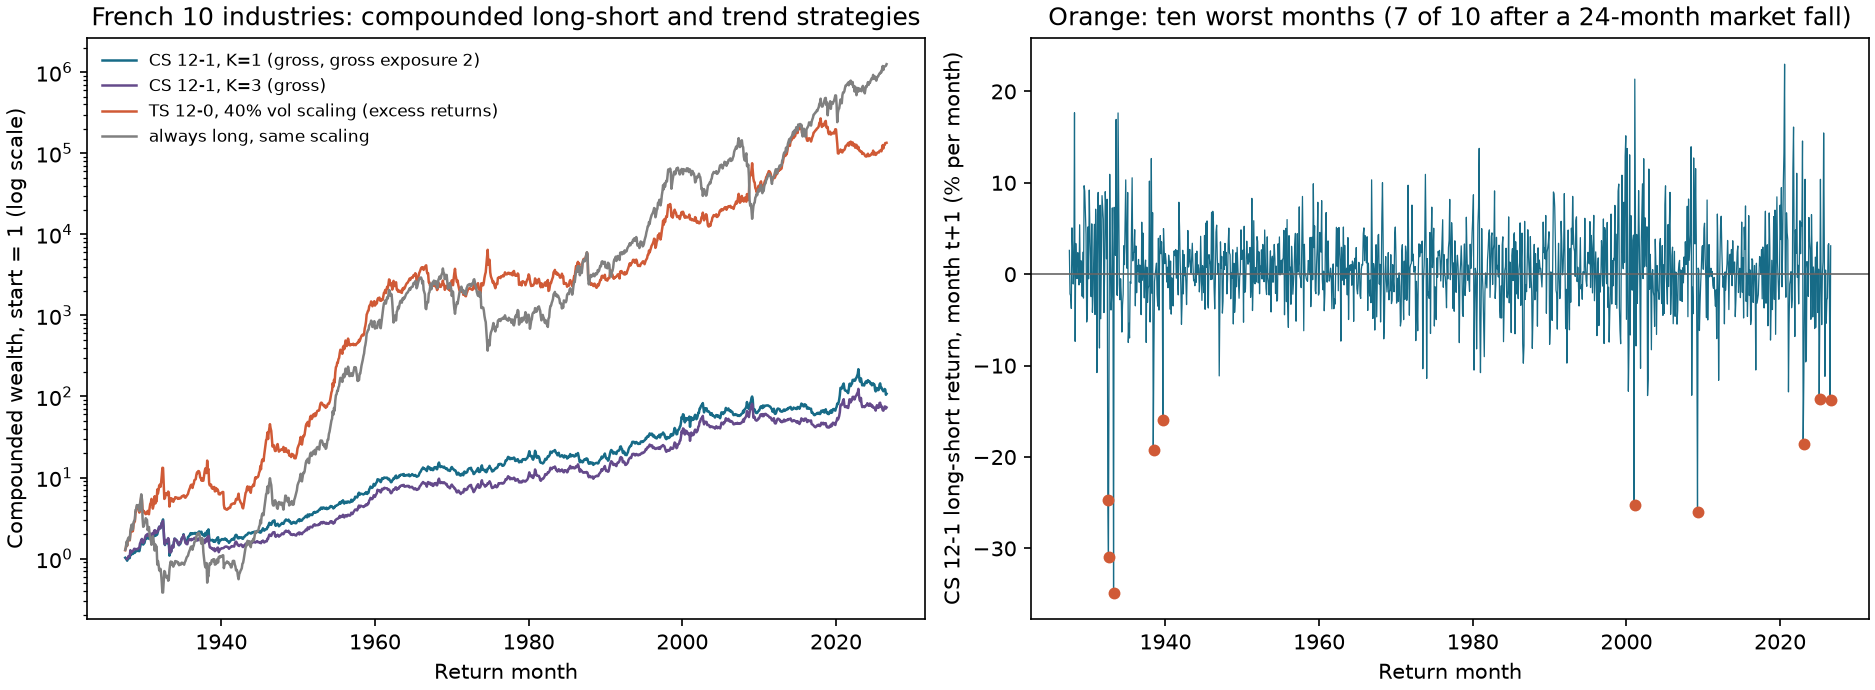
Figure 25-3:
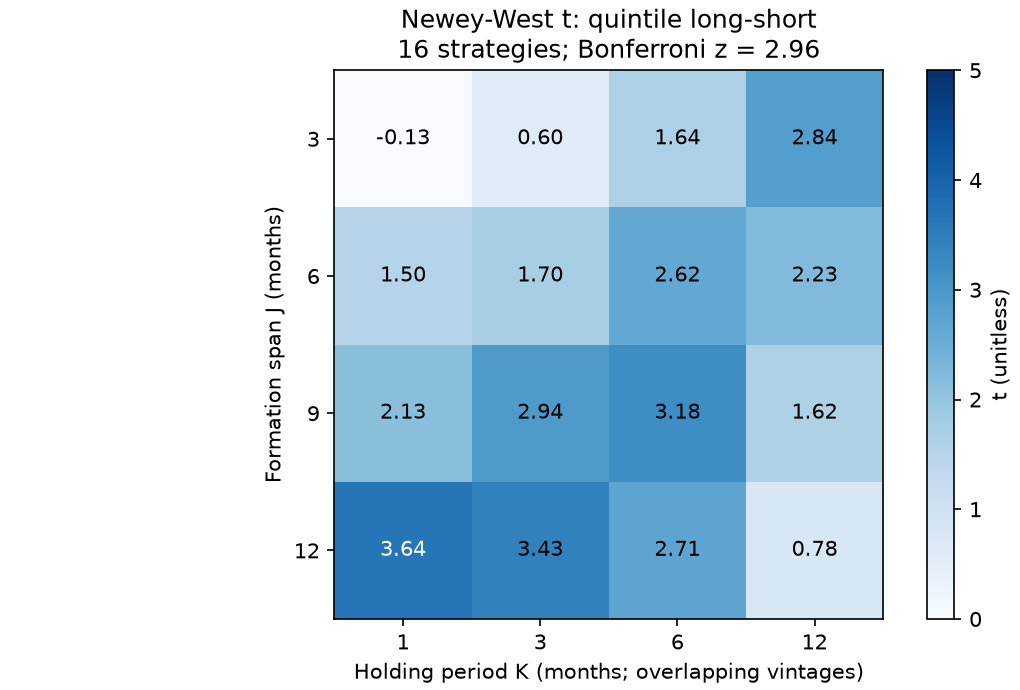
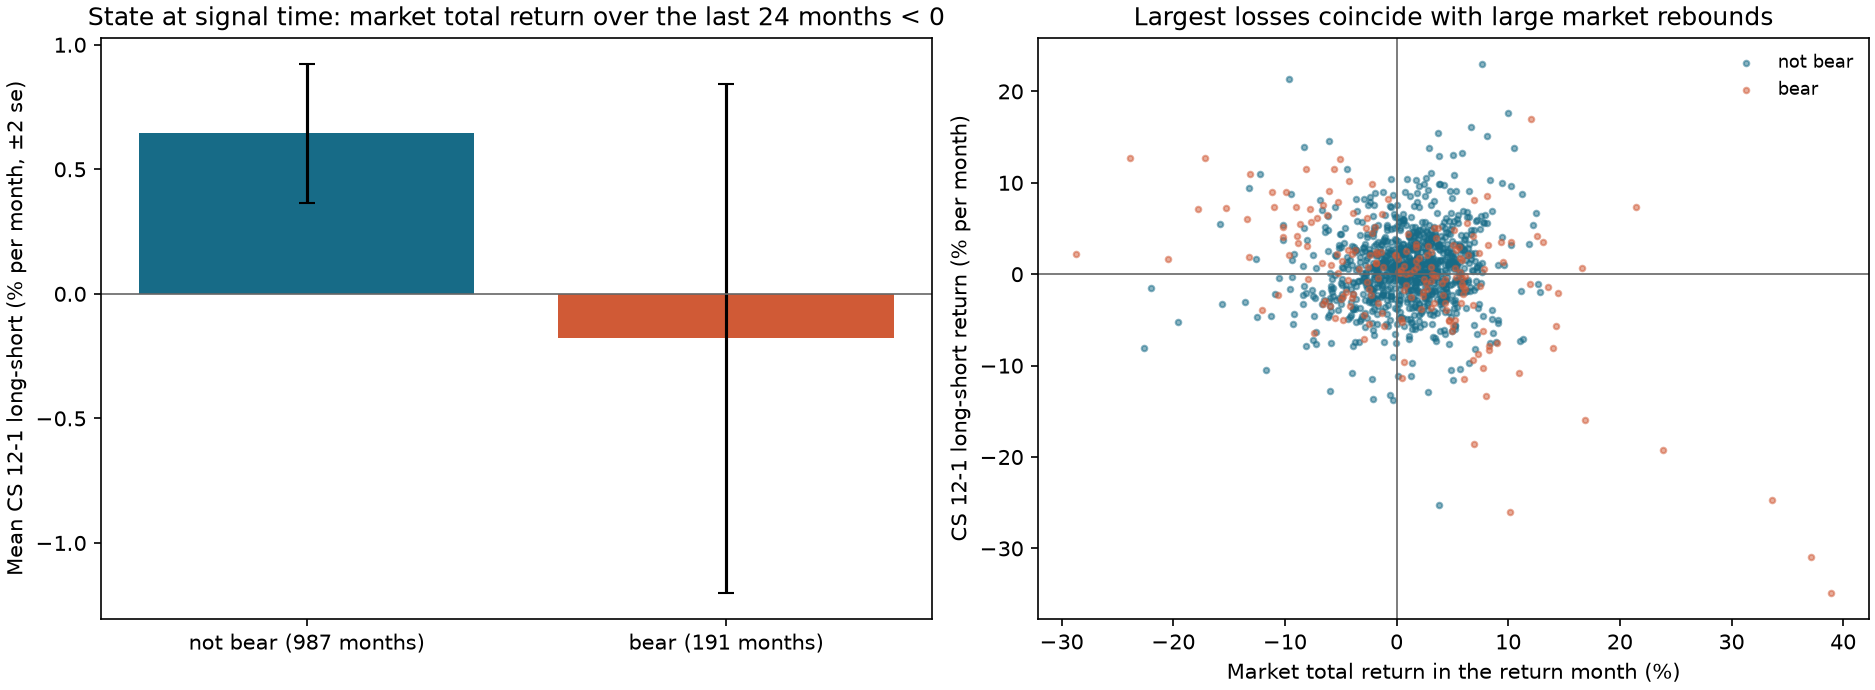
Figure 25-4: Crash states. Left: classify signal months by whether the market’s cumulative total return over the prior 24 months was negative; show the next-month average cross-sectional 12–1 long-short return:
11. Historical market case
Data. The same frozen French 10-industry value-weighted monthly returns as Chapters 22–24 (processed CSV SHA-256 3b097d810c295d64eedfa1ece7067ff2a0707f5ca90e33935df9949251f70950, July 1926 through August 2026, 1,202 months) and FF3 Mkt-RF and RF (processed SHA-256 c19770a19a0ac47ad1c29074f57234570aeaa9725212cb4fa8146a2846c52814). The industry portfolios are revised published returns, 10 assets, not individual stocks and not an execution series. No new data were downloaded for this chapter.
Cross-sectional 12–1 (five quantiles, two industries per bucket, equal-weighted, formed monthly). Signal months run from June 1927 through July 2026. There are no ties in 12–1 formation returns in any of the 1,191 months with formation returns, so each bucket has exactly two industries. The one-month variants (1–0 and 1–1) each have ties in 60 months; ties receive average ranks, so an extreme bucket may contain 1 or 3 industries, but each long and short leg still sums to 1.
| Gross mean (% per month) | Gross |
Net mean (10 bp per unit) | Net |
Mean turnover | |
|---|---|---|---|---|---|
| 1 | 0.519 | 3.64 | 0.427 | 2.99 | 0.904 |
| 3 | 0.474 | 3.43 | 0.423 | 3.06 | 0.518 |
| 6 | 0.347 | 2.71 | 0.308 | 2.40 | 0.364 |
Averaging conventions. For K=1/3/6, gross returns have 1190/1188/1185 valid months and net returns have 1189/1187/1184. The first valid target has no prior comparable weight, so turnover and net return are missing. Mean turnover uses the valid rows of weight differences themselves and may include a final row without a next-month return label. Thus gross mean minus net mean need not equal 10 bp times this turnover column. Align gross returns and turnover to the same valid months when comparing costs. This table preserves each historical series' own convention; do not infer a new cost or revise history from the rounded displays.
Monthly volatility is 4.9% for
Window variants (
| Window | Months | Mean (% per month) | |
|---|---|---|---|
| 12–1 (months |
1190 | 0.519 | 3.64 |
| 12–0 (months |
1190 | 0.621 | 4.41 |
| 1–0 (month |
1201 | 0.740 | 5.61 |
| 1–1 (month |
1200 | ||
| 6–1 (months |
1196 | 0.209 | 1.50 |
| 3–1 (months |
1199 |
This table has six rows. Combined with the 16 strategies in the
| 1 | 3 | 6 | 12 | |
|---|---|---|---|---|
| 3 | 0.60 (0.06) | 1.64 (0.13) | 2.84 (0.17) | |
| 6 | 1.50 (0.21) | 1.70 (0.22) | 2.62 (0.28) | 2.23 (0.19) |
| 9 | 2.13 (0.30) | 2.94 (0.39) | 3.18 (0.39) | 1.62 (0.15) |
| 12 | 3.64 (0.52) | 3.43 (0.47) | 2.71 (0.35) | 0.78 (0.08) |
Time-series momentum (excess returns; 40% target annual volatility per asset; volatility is the standard deviation over the prior 36 months, with at least 12 months).
| Portfolio | Mean (% per month) | Monthly SD (%) | Annualized Sharpe | Mean gross exposure | Mean net exposure | |
|---|---|---|---|---|---|---|
| TS 12–0 (includes most recent month) | 1.391 | 5.46 | 8.79 | 0.55 | 2.50 | 1.05 |
| TS 12–1 (skips most recent month) | 1.197 | 4.66 | 8.86 | 0.47 | 2.50 | 1.01 |
| Always long (same scaling) | 1.779 | 5.79 | 10.61 | 0.58 | 2.50 | 2.50 |
TS 12–0 is 0.389% per month below always long (difference-series
Crash states. There are 191 signal months (16.2% of months with a defined state) in which the market’s total return (Mkt-RF plus RF) over the past 24 months is negative. The next-month long-short mean is
| Signal month → return month | Long-short (%) | Bear state | Market total return in return month (%) |
|---|---|---|---|
| 1933-03 → 1933-04 | Yes | ||
| 1932-07 → 1932-08 | Yes | ||
| 2009-03 → 2009-04 | Yes | ||
| 2000-12 → 2001-01 | No | ||
| 1932-06 → 1932-07 | Yes | ||
| 1938-05 → 1938-06 | Yes | ||
| 2022-12 → 2023-01 | Yes | ||
| 1939-08 → 1939-09 | Yes | ||
| 2026-06 → 2026-07 | No | ||
| 2025-01 → 2025-02 | No |
Seven follow a bear state; the market’s total return is positive in eight return months. The maximum drawdown of cross-sectional 12–1 (
What can and cannot be said. We can say that 12–1 cross-sectional long-short returns were positive and significant on 10 industry portfolios over 1927–2026 (
12. Common mistakes
Mistake 1: shifting the window by one month. Section 8.1: the same asset’s 12–1 signal is 17.72%, one month earlier it is 15.47%, one month later it is 12.91%, and 12–0 is 10.65%. Fix: use formation_return(window=11, skip=1) and pass Chapter 23, code segment five’s test that “changing the future does not change the past.”
Mistake 2: summing instead of compounding. Section 6.2:
Mistake 3: inconsistent skipped months in cross-sectional and time-series momentum. Comparing MOP’s 12–0 with JT’s 12–1 confounds the window difference with the strategy difference: in the industry data, the means of 0.621% and 0.519% differ by 0.10 percentage points. Fix: report them side by side and label every window.
Mistake 4: using unadjusted prices after a split. Section 8.4: the split causes a 49% price decline while total return is +4%. In the example below, a “false loser” after a split ranks last and a true loser ranks ahead of it.
import numpy as np
import pandas as pd

from quant_course.factor_research import rank_cross_section

idx = pd.period_range("2020-01", periods=3, freq="M")
prices = pd.DataFrame({"split_stock": [100.0, 51.0, 52.0], "true_loser": [100.0, 90.0, 85.0]}, index=idx)   # 2-for-1 split in month 2 (+$1 dividend per new share)
unadjusted = prices.iloc[-1] / prices.iloc[0] - 1
adjusted_split = (2 * 51.0 + 2 * 1.0) / 100.0 * (52.0 / 51.0) - 1                    # total-return chain: split month, then 52/51
adjusted = pd.Series({"split_stock": adjusted_split, "true_loser": 85.0 / 100.0 - 1})
rank_u, rank_a = rank_cross_section(unadjusted.to_numpy()), rank_cross_section(adjusted.to_numpy())
assert rank_u[0] == 1.0 and rank_a[0] == 2.0                                          # unadjusted: split stock is the worst; adjusted: it is the best
print(unadjusted.round(3).to_dict(), adjusted.round(3).to_dict())
Mistake 5: stitching futures prices directly. Section 6.8: the stitched series creates a false 3.92% return. A time-series signal would mistake the roll jump for a trend.
import numpy as np

a_prices, b_prices = [100.0, 102.0, 104.0], [108.0, 109.0, 111.0]          # contract B trades at a premium: contango
spliced = np.array([100.0, 102.0, 108.0, 109.0, 111.0])                     # roll between the second and third prices
naive_return = spliced[-1] / spliced[0] - 1                                  # "12-month" return from the spliced series
true_a = a_prices[1] / a_prices[0] - 1
true_b = b_prices[2] / b_prices[0] - 1
true_total = (1 + true_a) * (1 + true_b) - 1                                  # hold A to the roll, then hold B
assert naive_return > true_total + 0.04                                       # the splice overstates the move by the roll gap
assert np.sign(naive_return) == np.sign(true_total) == 1
print(round(naive_return, 4), round(true_total, 4))
Mistake 6: backtesting a universe of current survivors. Taking today’s listed companies back through history uses future information—“survived until today”—to select the stocks. In the fixed-winner-leg example, omitting delisted losers overstates the future return of the loser leg and understates WML. With a dynamic universe, it also changes winners, ranks, and weights, so the bias direction is not fixed. Numerical example: 10 formation-period losers; 9 later survive and return an average of signal_time and include realized delisting returns in the subsequent labels; do not select history using today’s list or feed future delisting returns into the signal. This chapter has no individual-stock data; the Project 4 preparation layer records this as a data gap.
Mistake 7: using a naive
Mistake 8: ignoring turnover and costs. Monthly turnover for cross-sectional 12–1 is 0.904 (gross exposure 2). A 10 bp unit cost removes 0.092 percentage points, about 18% of the gross mean; the
Mistake 9: leaving window searches out of the ledger. This chapter evaluates 19 distinct cross-sectional strategies across window variants and the
13. Quantitative research application
Momentum fields in Project 4 and the checklist for real research. The current machine signal calls formation_return(window=11, skip=1). The price-contract column is named total_return and is defined as a constructed decimal monthly total return; signal_time is month-end. The constructed price layer does not record an actual available_at. The table below lists descriptive fields needed for future real research (for example, total_return_m is not a current machine column). Do not describe its vendor or availability-time fields as data already obtained at this layer.
| Field | Source | Time field | Unit | Missing-data rule |
|---|---|---|---|---|
total_return_m |
Total-return prices or vendor total return | Month-end (event_time) and available_at |
Decimal | A missing return cell makes the window NaN; reject a missing calendar-month row before calculation, do not fill it. |
mom_12_1 |
Calculated | signal_time |
Decimal | NaN with fewer than 12 months of history. |
rank_pct |
Same-date percentile | signal_time |
0–1 | NaN with fewer than 2 valid assets on that date. |
universe_member |
Historical constituents | Version available at signal_time, including delisted firms |
Boolean | Without historical constituents, do not claim to have backtested. |
label_1m |
Next-month return, including delisting return | Label interval start and end | Decimal | Use the delisting return in the delisting month; do not drop it as NaN. |
Research workflow. First write a frozen plan (Chapter 22): the hypothesis that assets with higher same-date 12–1 returns have higher next-month returns; the 12–1 signal window;
What this chapter completes and leaves open. Completed: the core window and portfolio functions, and a full report on 10 industries. Not completed: individual-stock momentum (historical constituents, delisting returns, and total-return prices are missing), a cost-adjusted Project 4 strategy (Chapters 35–36), or dynamic momentum. Chapter 28 combines momentum with value and quality.
13.1 Return definitions and the Project 4 interface, field by field
| Object to calculate | Required inputs | What cannot substitute |
|---|---|---|
| Monthly stock total return | Share-count changes, splits, cash distributions, and delisting treatment, or a total-return series with these adjustments explicitly defined | Difference in unadjusted closing prices; adding dividends again to a total-return series that already includes them |
| Stock price return | Split-adjusted price, explicitly labeled as excluding cash distributions | Calling it total-return momentum |
| Futures return | P&L while holding the same contract, roll rules, notional-exposure/margin convention, and collateral-interest treatment | Price difference across stitched contracts; it is not profit from executing a roll |
| Current constructed P4 total return | Decimal monthly simple total return defined by the generator, continuous monthly index, sampled using contemporaneous membership | Exchange-traded prices or evidence of live fills |
For the stock example, if the wealth product over the other formation months is
Project 4’s mom_12_1 actually calls formation_return(..., 11, 1). Its return input is the constructed monthly total return in the contract, and the month-
14. Chapter summary
Momentum is determined by three things: window endpoints (12–1 uses months signal_time. On 10 industry portfolios, 12–1 is positive and remains positive after assumed costs, but only a few of 19 distinct cross-sectional variants pass the multiple-testing threshold; time-series trend does not beat always long; and the worst months cluster in rebounds after bear states. Scope: industry portfolios are not individual stocks; costs are assumed; the crash description is not a replication; this chapter has no individual-stock data.
15. Exercises
25-E01 (by hand). An asset’s monthly returns over months 1–14 are
25-E02 (by hand). Eight assets have 12–1 formation returns
25-E03 (by hand). Four assets have signs
25-E04 (by hand). Two assets have seven months of vintages:
25-E05 (by hand). A stock is priced at 90 and undergoes a 3-for-1 split; after the split it is priced at 31 and pays a cash dividend of 0.5 per new share. Calculate total return and the unadjusted price change. If this month is in a 12–1 formation window, by how many percentage points is the signal understated?
25-E06 (by hand). Contract A is priced at 50 and 52; at the roll, contract B is priced at 55 and 56.1. Find the “returns” from the stitched price series, the available returns, and the false return at the roll.
25-E07 (by hand). All market monthly returns are
25-E08 (concept and calculation). Asset X returns
25-E09 (interpretation). Table 11 reports a monthly mean of 1.391% for TS 12–0 and 1.779% for always long. Explain why 1.391% cannot be treated as trend alpha and how to test whether trend adds value.
25-N01 (calendar and data diagnostic). Calculate 12–1, 12–0, and the sum from the actual calendar-month table in Section 3.1; mark the formation, skipped, and holding times. If someone multiplies the January 2026 return into the signal, identify the leakage. Then, let the wealth product for the other formation months in the split example in Section 6.7 be
16. Programming exercises
25-P01. Write a test that, for the 14 monthly returns, asserts that formation_return(window=11, skip=1) in month 13 equals the value in Section 8.1 and that changing returns in month 13 and later does not change that row. Acceptance criterion: both assertions pass.
25-P02. Generate vintage weights for 24 months and 10 assets, then calculate turnover for
25-P03. On a constructed random-walk panel with positive drift (10 assets, 480 months, monthly drift 0.5%, monthly volatility 4%), calculate time-series 12–0 and always long with the same scaling; report their means,
17. Challenge problems
25-C01 (proof). Prove that adjacent-month turnover for an overlapping-holdings portfolio
25-C02 (open-ended). Write a complete frozen plan and data-gap table for the Project 4 momentum signal: window, total-return definition, historical constituents and delisting returns, cost and stock-borrow assumptions, crash-state reporting, and multiple-testing count. Identify fields unavailable in the course’s current data. Grading: plan completeness 25, correct time fields 25, data gaps 25, crash and cost treatment 25.
18. Complete solutions and reference implementations
25-E01. 12–1: compound months 2–12,
25-E02. In the given asset order, the ascending ranks for formation returns
25-E03. Unnormalized position is
25-E04. For
25-E05. Total return is
25-E06. Stitched prices are 50, 52, 55, 56.1, giving returns of 4.00%, 5.77%, and 2.00%. Available returns: hold A for
25-E07. Number months from 1 through 30; the window is months
25-E08. X sums to 0 and compounds to
25-E09. The trend portfolio’s average net exposure is 1.05 and 67% of assets are classified as long, so the 1.391% mean includes an equity risk premium (after scaling). Always long with the same scaling earns 1.779%. Test trend’s incremental value using the difference series (TS minus always long) or an intercept from a regression of TS on always long. The difference-series mean is
25-P01 reference implementation
import numpy as np
import pandas as pd

from quant_course.factor_signals import formation_return

r = [0.03, -0.02, 0.05, 0.01, -0.04, 0.06, 0.02, -0.01, 0.04, 0.03, -0.02, 0.05, -0.06, 0.02]
idx = pd.period_range("2020-01", periods=14, freq="M")
frame = pd.DataFrame({"a": r}, index=idx)
s = idx[12]
base = formation_return(frame, window=11, skip=1)
assert abs(base.loc[s, "a"] - (np.prod(1 + np.array(r[1:12])) - 1)) < 1e-12
shocked = frame.copy(); shocked.iloc[12:] = 0.9                                  # month 13 and later change
pd.testing.assert_frame_equal(base.iloc[:13], formation_return(shocked, window=11, skip=1).iloc[:13])
25-P02 reference implementation: see code segment four in Section 9, keep the K=1/3/6 loop and replace its input with vint = pd.DataFrame(rng.choice([-0.5, 0.0, 0.5], size=(24, 10)), index=idx, columns=[f"A{i}" for i in range(10)]). Leave the difference, formula, and assertions unchanged; this supplies the required ten columns.
25-P03 reference implementation
import numpy as np
import pandas as pd

from quant_course.momentum import ex_ante_volatility, strategy_returns, time_series_sign, tsmom_weights

rng = np.random.default_rng(3)
idx = pd.period_range("1980-01", periods=480, freq="M")
returns = pd.DataFrame(rng.normal(0.005, 0.04, (480, 10)), index=idx, columns=[f"A{i}" for i in range(10)])
vol = ex_ante_volatility(returns)
sig = time_series_sign(returns, window=12, skip=0)
ts = strategy_returns(tsmom_weights(sig, vol, target_vol=0.40), returns).dropna()
always = strategy_returns(tsmom_weights(pd.DataFrame(1.0, index=idx, columns=returns.columns).where(vol.notna()), vol, target_vol=0.40), returns).dropna()
diff = (ts - always).dropna()
t = diff.mean() / (diff.std(ddof=1) / np.sqrt(len(diff)))
assert always.mean() > ts.mean() and t < -2                     # independent returns: no trend to exploit; the 12-month sign filter shorts after a negative cumulative return and gives up the drift
print(round(100 * ts.mean(), 3), round(100 * always.mean(), 3), round(t, 2))
The output is about 0.500, 1.565, and
25-C01.
25-C02 (grading guidance and reference). Plan elements: state the hypothesis and sign (winners have higher next-month returns; positive direction); use 12–1 total returns; use historical constituents as of signal_time, including delisting returns; use an 11-month window and skip 1 month; equal-weight the highest and lowest deciles; set
25-N01 complete solution. January–November 2025 has 11 observations and cumulative wealth of 1.1547369892, so 12–1 is 15.4737%; the sum is 15%. Including December gives 12–0 at 21.2474%. December is the skipped month; January 2026 is the next-month holding label and is unknown when the signal is formed, so including it is look-ahead. In the split example, the correct monthly total return is 4% and the unadjusted monthly return is -49%, a 53-percentage-point difference. Multiplying by
19. Further reading
- Must Know: Jegadeesh and Titman (1993), opening of §§I and II; read the J/K strategies, overlapping holdings, and their Bonferroni discussion of 32 tests.
- Must Know: Asness, Moskowitz, and Pedersen (2013), printed pp. 936–937; read the MOM2–12 definition and reason for skipping a month.
- Should Know: Moskowitz, Ooi, and Pedersen (2012), §§2.4 and 4.1; read volatility scaling and equation (5) for TSMOM.
- Should Know: Daniel and Moskowitz (2014 working paper), abstract and note to Table 3; read the crash-state definition. The journal version was not read.
- Advanced: Original paper by Moskowitz and Grinblatt (1999) on industry momentum; not read for this chapter.
- Optional: French database Mom-factor description page; check the definition of prior (2–12).
20. References
Citation keys and the scope of what was read are listed in source_notes.md.
- CH25_JT1993: Jegadeesh, N., and Titman, S. (1993). Journal of Finance 48(1), printed pp. 68–69.
- CH25_AMP2013: Asness, C. S., Moskowitz, T. J., and Pedersen, L. H. (2013). Journal of Finance 68(3), printed pp. 936–937.
- CH25_MOP2012: Moskowitz, T. J., Ooi, Y. H., and Pedersen, L. H. (2012). Journal of Financial Economics 104(2), §§2.4 and 4.1.
- CH25_DM2014: Daniel, K., and Moskowitz, T. J. (2014). NBER Working Paper 20439, abstract, printed p. 8, and note to Table 3; journal version not read.
- CH25_FRENCH_MOM_PAGE: Ken French database Mom-factor description page.
- FRENCH: Frozen French industry and FF3 snapshots (
data/manifests/).